
A Quick Take On Youxin Technology Ltd
Youxin Technology Ltd, (YAAS) has filed to raise $8 million in an IPO of its Class A ordinary shares, according to an SEC F-1 registration statement.
The firm provides a software-as-a-service (“SaaS”) platform for retail businesses in China.
YAAS has produced top line revenue decline on a tiny base and substantial operating losses, and the IPO is wildly overpriced.
My outlook on the IPO is to Sell [Avoid].
Youxin Overview
Guangzhou, China-based Youxin Technology Ltd was founded to develop software to enable retail businesses to improve their customer relationship management [CRM] capabilities and grow their operations.
Management is headed by founder and CEO Mr. Shaozhang Lin, who has been with the firm since its inception and was previously Chief Technology Officer at Beijing Wuqiong Information Technology Ltd.
The company’s primary offerings include the following:
-
Inventory management
-
Store innovation
-
Cross-channel data integration
-
E-commerce
-
Mobile and web applications
-
Social media integrations.
As of March 31, 2023, Youxin has booked fair market value investment of $12.2 million in equity from investors, including a large syndicate of investors.
Youxin Customer Acquisition
The firm pursues customers via its direct sales and marketing efforts.
The company’s primary customer base is in the consumer goods, cosmetics and food and drink sectors.
In the most recent fiscal year, it had 25 customers for its professional services system and 183 customers using its payment channel services.
Selling expenses as a percentage of total revenue have dropped as revenues have decreased, as the figures below indicate:
|
Selling |
Expenses vs. Revenue |
|
Period |
Percentage |
|
Six Mos. Ended March 31, 2023 |
31.7% |
|
FYE September 30, 2022 |
73.2% |
|
FYE September 30, 2021 |
60.6% |
(Source – SEC.)
The Selling efficiency multiple, defined as how many dollars of additional new revenue are generated by each dollar of Selling expense, fell to negative 91.1x) in the most recent reporting period, as shown in the table below:
|
Selling |
Efficiency Rate |
|
Period |
Multiple |
|
Six Mos. Ended March 31, 2023 |
-1.1 |
|
FYE September 30, 2022 |
0.2 |
(Source – SEC.)
The Rule of 40 is a software industry rule of thumb that says that as long as the combined revenue growth rate and EBITDA percentage rate equal or exceed 40%, the firm is on an acceptable growth/EBITDA trajectory.
YAAS’s most recent calculation was negative (447%) as of March 31, 2023, so the firm has performed very poorly, per the table below:
|
Rule of 40 |
Calculation |
|
Recent Rev. Growth % |
-26% |
|
EBITDA % |
-421% |
|
Total |
-447% |
(Source – SEC.)
Youxin’s Market & Competition
According to a 2022 market research report by Daxue Consulting, the Chinese market for CRM software is still in its nascent stage.
Many Chinese companies do not rely on software for their customer relationships. The adoption of CRM systems has been largely concentrated on the east coast of the country, with the Hong Kong region leading the way.
Most Chinese firms seek a version of CRM referred to as “SCRM,” with the “S” standing for “Social,” so they have a strong preference for CRM systems that are integrated with major social platforms in China.
Also, below is a heat map showing the adoption of CRM software in China:
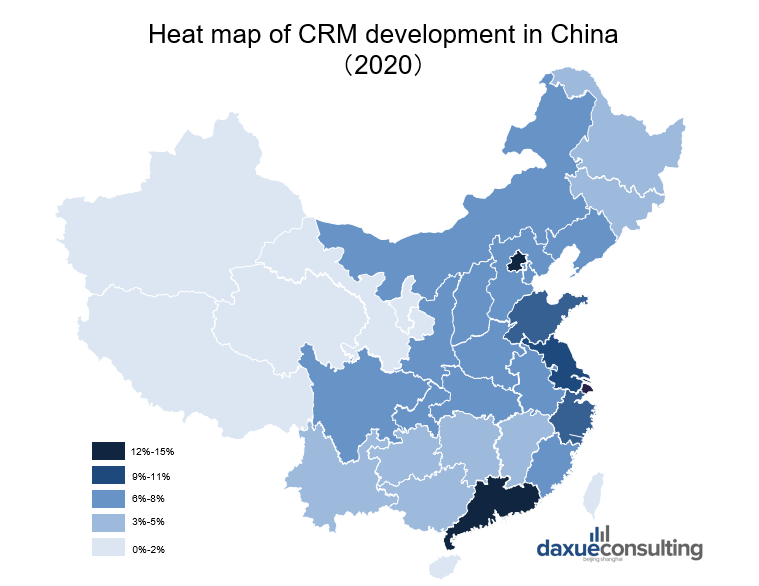
CRM Software Usage In China (Daxue Consulting)
Major competitive or other industry participants include the following:
-
Force.com
-
ClickPaas
-
Mingdao Cloud
-
Youzan
-
Yongyou
-
Xuanwu Cloud
-
Salesforce
-
Tencent Qidian
-
Fxiaoke
-
Xiaoshouyi
-
Waiqin 365
Youxin Technology Ltd Financial Performance
The company’s recent financial results can be summarized as follows:
-
Contracting top line revenue
-
Reduced gross profit and variable gross margin
-
Material operating losses
-
Variable cash used in operations
Below are relevant financial results derived from the firm’s registration statement:
|
Total Revenue |
||
|
Period |
Total Revenue |
% Variance vs. Prior |
|
Six Mos. Ended March 31, 2023 |
$ 407,037 |
-26.2% |
|
FYE September 30, 2022 |
$ 1,277,066 |
15.4% |
|
FYE September 30, 2021 |
$ 1,106,860 |
|
|
Gross Profit (Loss) |
||
|
Period |
Gross Profit (Loss) |
% Variance vs. Prior |
|
Six Mos. Ended March 31, 2023 |
$ 238,769 |
-18.8% |
|
FYE September 30, 2022 |
$ 695,727 |
7.1% |
|
FYE September 30, 2021 |
$ 649,517 |
|
|
Gross Margin |
||
|
Period |
Gross Margin |
% Variance vs. Prior |
|
Six Mos. Ended March 31, 2023 |
58.66% |
5.4% |
|
FYE September 30, 2022 |
54.48% |
-7.2% |
|
FYE September 30, 2021 |
58.68% |
|
|
Operating Profit (Loss) |
||
|
Period |
Operating Profit (Loss) |
Operating Margin |
|
Six Mos. Ended March 31, 2023 |
$ (1,714,244) |
-421.2% |
|
FYE September 30, 2022 |
$ (6,772,400) |
-530.3% |
|
FYE September 30, 2021 |
$ (4,245,519) |
-383.6% |
|
Comprehensive Income (Loss) |
||
|
Period |
Comprehensive Income (Loss) |
Net Margin |
|
Six Mos. Ended March 31, 2023 |
$ (1,989,613) |
-488.8% |
|
FYE September 30, 2022 |
$ (5,561,138) |
-435.5% |
|
FYE September 30, 2021 |
$ (4,239,548) |
-383.0% |
|
Cash Flow From Operations |
||
|
Period |
Cash Flow From Operations |
|
|
Six Mos. Ended March 31, 2023 |
$ (1,554,219) |
|
|
FYE September 30, 2022 |
$ (5,273,756) |
|
|
FYE September 30, 2021 |
$ (4,607,453) |
|
|
(Glossary Of Terms.) |
(Source – SEC.)
As of March 31, 2023, Youxin had $912,483 in cash and $2.2 million in total liabilities.
Free cash flow during the twelve months ending March 31, 2023, was negative ($4.4 million).
Youxin Technology Ltd IPO Details
Youxin intends to raise $8 million in gross proceeds from an IPO of its Class A ordinary shares, offering two million shares at a proposed price of $4.00 per share.
No existing shareholders have indicated an interest in purchasing shares at the IPO price.
The firm will be offering two million shares and has also registered for sale an additional 1.75 million shares for sale by selling stockholders.
If those additional 1.75 million shares come onto the market in a concentrated fashion, the negative effects to the firm’s stock price could be substantial.
Class A shareholders will be entitled to one vote per share and Class B shareholders will have ten votes per share.
The company will be a “controlled company” under Nasdaq’s rules, with the founder and CEO having majority voting control.
Assuming a successful IPO, the company’s enterprise value at IPO would approximate $126 million, excluding the effects of underwriter over-allotment options.
The float to outstanding shares ratio (excluding underwriter over-allotments) will be approximately 6.02%. This would make the stock a “low float” stock subject to high volatility.
Management says it will use the net proceeds from the IPO as follows:
approximately $3,080,000 million or 50% of the net proceeds for research and development, including development of our SaaS standard product and further investment in our cloud services;
approximately $1,232,000 million or 20% of the net proceeds for investment in our sales and marketing, including expanding distribution channels for existing and future market; and
approximately $1,848,000 million or 30% of the net proceeds for general corporate purposes, which may include capital expenditures, potential strategic investments and acquisitions, although we have not identified any specific investments or acquisition opportunities at this time.
(Source – SEC.)
Management’s presentation of the company roadshow is not available.
Regarding outstanding legal proceedings, management said it was not aware of any legal proceedings against the firm as of September 30, 2022.
The listed bookrunner of the IPO is Univest Securities.
Valuation Metrics For Youxin
Below is a table of relevant capitalization and valuation figures for the company:
|
Measure [TTM] |
Amount |
|
Market Capitalization at IPO |
$133,000,000 |
|
Enterprise Value |
$125,927,517 |
|
Price / Sales |
117.46 |
|
EV / Revenue |
111.22 |
|
EV / EBITDA |
-28.02 |
|
Earnings Per Share |
-$0.11 |
|
Operating Margin |
-396.93% |
|
Net Margin |
-330.52% |
|
Float To Outstanding Shares Ratio |
6.02% |
|
Proposed IPO Midpoint Price per Share |
$4.00 |
|
Net Free Cash Flow |
-$4,386,045 |
|
Free Cash Flow Yield Per Share |
-3.30% |
|
Debt / EBITDA Multiple |
0.00 |
|
CapEx Ratio |
45,688.97 |
|
Revenue Growth Rate |
-26.24% |
|
(Glossary Of Terms.) |
(Source – SEC.)
Commentary About Youxin’s IPO
YAAS is seeking U.S. public capital market investment to fund its growth efforts.
The firm’s financials have shown declining top line revenue, lowered gross profit and variable gross margin, substantial operating losses and fluctuating cash used in operations.
Free cash flow for the twelve months ending March 31, 2023, was negative ($4.4 million).
Selling expenses as a percentage of total revenue have varied as revenue has declined; its Selling efficiency multiple was negative (1.1x) in the most recent reporting period.
The firm currently plans to pay no dividends and to retain any future earnings for reinvesting back into the company’s growth and working capital needs.
The company is subject to both Cayman Islands and Chinese laws restricting the payment of dividends to certain conditions.
In addition, U.S. investors would only have an interest in a Cayman Islands company with interests in subsidiaries in China.
Such firms have historically provided poor returns to U.S. public capital market investors, with limited company communication and poor results common post-IPO.
The company’s Rule of 40 results have been poor, with a revenue decline and sharply negative operating results.
The market opportunity for providing CRM software and related services in China is large but features a number of competitors and a general lack of use of such software by most Chinese companies.
Business risks to the company’s outlook as a public company include its small size, thin capitalization and lack of a track record of generating growth, even on a tiny revenue base.
The company is also both a foreign private issuer and an emerging growth company. These designations enable management to provide less information to public markets.
Management is seeking an Enterprise Value/Revenue multiple of approximately 111x, a preposterous valuation for a company that can’t produce growth from a small base.
My outlook on the IPO is to Sell [Avoid].
Expected IPO Pricing Date: To be announced.
Read the full article here