Evidence is mounting that the gold rally is ready for an intermediate term correction. New investors shouldn’t buy gold or gold ETFs now; better prices lie ahead. Current holders should lighten gold positions by 30% if prices move any higher. We have a maximum upside target of $2,450, which is only 5% higher. We are intermediate to long-term investors; not short-term traders.
Remember, a correction can be a time correction, a price correction or a combination of the two. This correction should last two or three months and might possibly take prices back to the breakout point of $2,050. The long-term trend, however, remains positive.
The indicators pointing to caution here are the same indicators that pointed to higher prices last October.
Why Investor Sentiment Is So Important
It’s not economic data itself, but how investors react to it that determines stock prices. Up to 50% or more of an asset’s price, either up or down, can be driven by the emotions of fear and greed alone. So, the Sentiment King doesn’t analyze the economic picture; we instead analyze what investors are doing and thinking. Measuring investor sentiment and investor expectations is a great, unexplored area of investing. Our forecasts are based on it.
The Evidence
Too much “call buying” in GLD
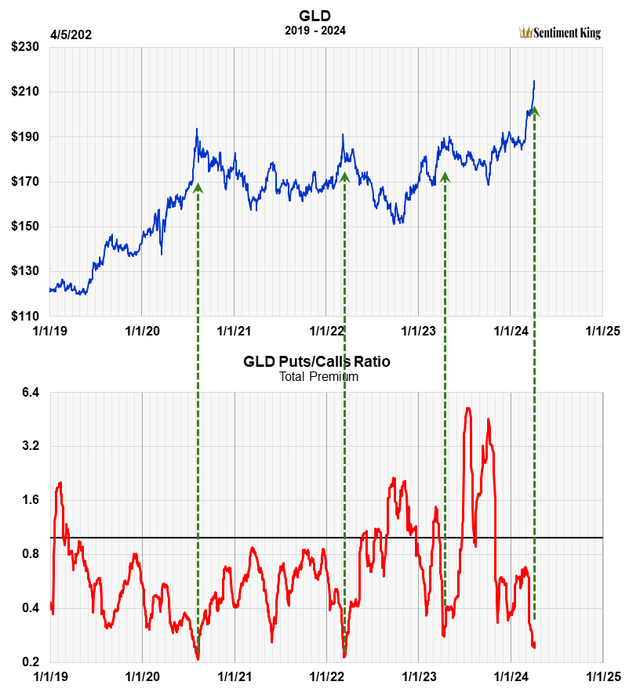
After the six-month gold rally, “too many” investors now believe the price of gold will move higher. This excess is a sure sign of an intermediate term top. You see this in the puts to calls ratio of GLD, the gold ETF. “Calls” are bets prices will move higher, while “puts” are bets they will move lower. The current ratio of .25 means four times more money is going into calls than puts.
This is an historically high level of optimism, and we’ve indicated with green arrows in the chart below the last three times this happened. Each occurred at, or near, an intermediate term top. The fourth green arrow on the right is the current situation.
As you can see, the opposite situation existed last October, when more than three times more money was going into “puts” than “calls.” This was a major reason why we were so bullish then.

The ratio of money going into put and call options of GLD (The Sentiment King)
“Too Many” newsletter writers are bullish on gold
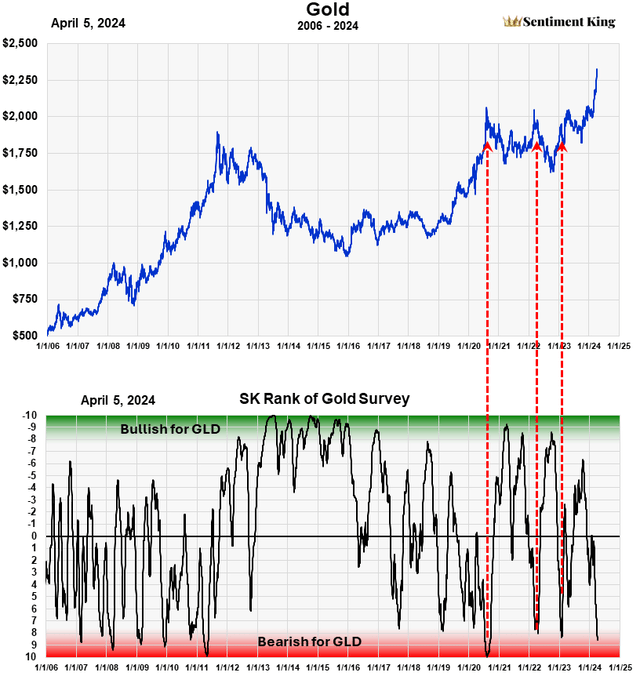
Mark Hulbert of Hulbert ratings has been keeping track of how bullish or bearish newsletter writers are on gold for over twenty five years. We take his daily numbers and form a long-term moving average of writer sentiment and plot that on our Sentiment King ranking scale shown below. Red zone readings mean writers are “too bullish”, which is bearish for gold. On the other hand, Green Zone readings are bullish for gold. It is an intermediate term indicator for gold.

The Sentiment King ranking of the Hulbert Survey of Newsletter writers on gold (The Sentiment King)
Our current numbers have just entered the red zone. We’ve indicated with three Red Arrows previous times bullish sentiment by newsletter writers was this extreme. Just like the puts to calls ratio, a red zone reading has usually preceded an intermediate term correction in the price of gold.
The long-term trend in gold is still higher
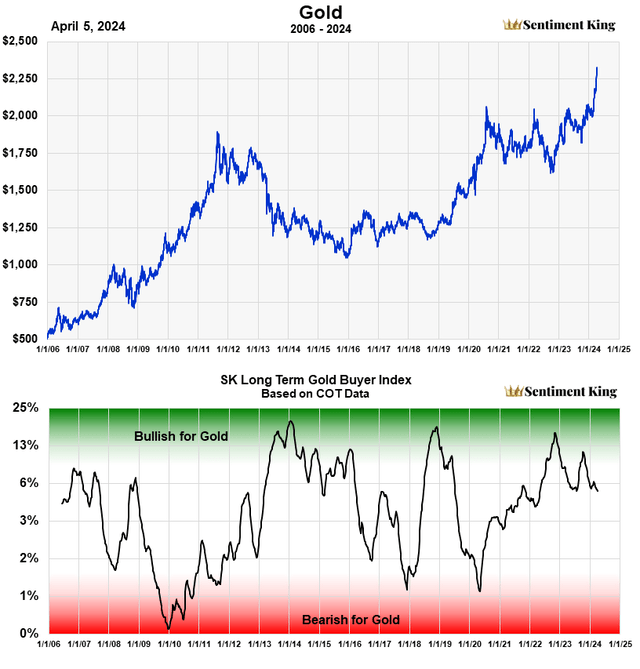
While we believe gold is headed for an intermediate term, two or three month correction, we still believe the long-term trend is higher. This view is based on this third indicator, which we presented last October. It’s the Sentiment King long-term gold buyer index. Last October it rendered a strong, long-term buy signal, and it continues in that vein even now.

The Sentiment King Long Term Gold Buyer Index (The Sentiment King)
The SK gold buyer index is made from commitment of trader’s data in gold futures supplied weekly by the CFTC. It’s a combination of the amount of shorting by money managers of gold futures compared to how much gold producers are buying. The chart above shows this indicator back to 2006. Green zone readings represent long term bullish outlook, while red zone readings signal caution long term. It’s definitely a long-term indicator.
The two, green zone signals that occurred in late 2022 and October 2023 are clearly visible. These signals were the major reason we published our article last October.
While the two earlier indicators in this article point to caution over the short to intermediate term, we’re very encouraged that this indicator still shows the long-term trend is positive.
We believe strongly in this long-term gold buyer index and will remain bullish long-term until the indicator finally gives a red zone reading.
A $2,450 Price Target
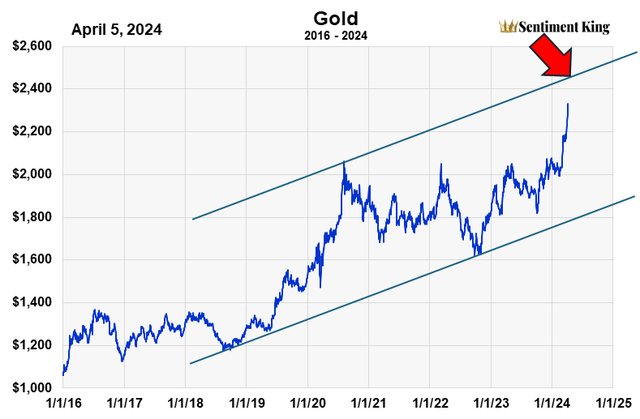
The chart below shows a possible maximum price target of $2,430 for gold. While both the “puts to calls” ratio and newsletter writer survey point to a correction, there is room for a possible gain of 5% from here. But that’s not much considering the risk.

Spot Gold (The Sentiment King)
To us as this data means investors shouldn’t buy gold at the current price – the risk far outweighs possible gain. Wait for a pull back, possibly to $2,050, which is the breakout level. The long-term trend is still positive.
Read the full article here


Leave a Reply