Investment updates
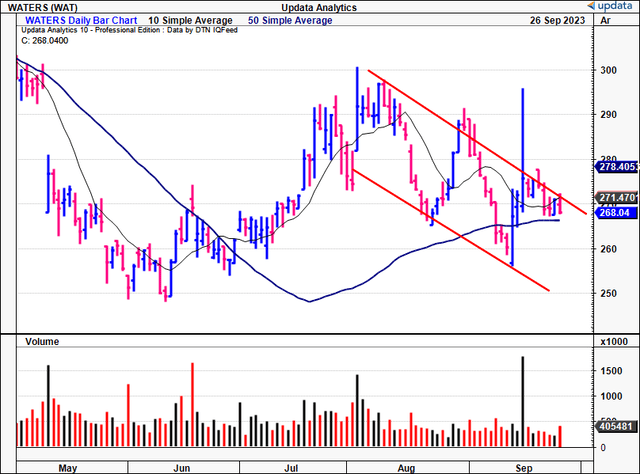
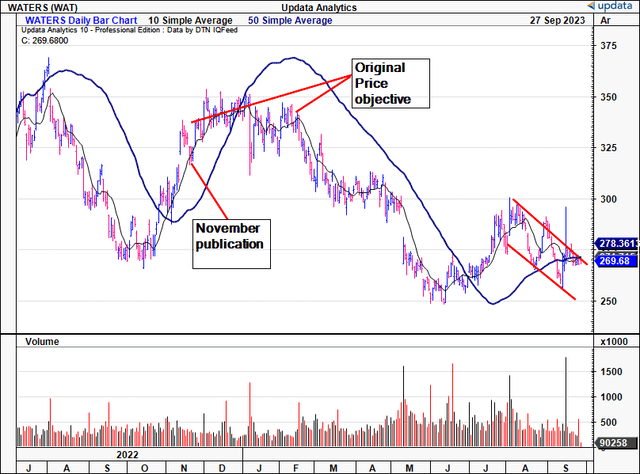
In November FY’22 I added Waters Corporation (NYSE:WAT) to our equity risk budget as a tactical allocation, seeking an initial price objective of $340/share. WAT took out this target and floated within a $10/share range into March FY’23, where it sharply turned course and repriced to the downside, as seen in Figure 1(a). More recently, it has tracked a downward cycle since August, as noted in Figure 1.
There were a number of positive outtakes posted in the November publication, many of which were market-related (namely positive technicals, and an uptick in fund ownership). But as Keynes purportedly said, “When the facts change, I change my mind”. Indeed, many of the investment facts have changed, and this report will cover each of these in detail. Net-net, I revise WAT back to a hold for the reasons outlined here today.
Figure 1.
Data: Updata
Figure 1(a).
Data: Updata
Critical findings supporting revised rating to hold
1. Recent financials
The Company operates in 2 specialized segments, Waters and TA. The Waters segment offers a range of high-performance liquid chromatography (“HPLC”), ultra-performance liquid chromatography (“UPLC”), mass spectrometry (“MS”), and precision chemistry consumables + services. It caters to the pharmaceutical, biochemical, industrial and academic industries, and governments.
On the other hand, the TA business specializes in thermal analysis, rheometry, and calorimetry instrument systems. These systems are critical in many industries, where precise measurement and analysis are essential for product development—think chemicals, pharmaceuticals and so forth. Even though these are 2 separate divisions, they have similar economics and customers, so WAT reports them in 1 consolidated segment.
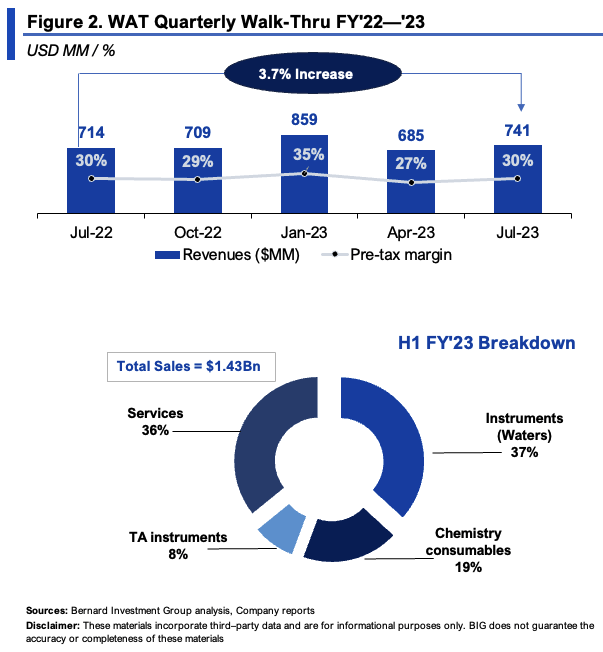
In Q2 FY’23, WAT put up $740.6mm in revenues, a 3.7% YoY increase on gross margin of ~59%. Management expects 300–400bps revenue growth in FY’23, calling for ~$3.1Bn at the top line by yearend on gross of 59%. Key revenue drivers in Q2 were its industrial, academic and government markets, up 20% collectively. Critically, MS revenues grew 40% YoY as well, offsetting ~400bps of downsides in its pharma markets. But it was its China footprint that caused the most troubles, down 25% YoY and clamping instrument volumes by ~200bps. Stripping out China, instruments were up 8% YoY.
Speaking of the divisional highlights:
- Instrument system sales in its Waters business were down 2% as mentioned, and booked ~$280mm in revenues. For the YTD, Waters instruments are down 4.8% YoY to $524.1mm.
- Chemistry consumables pulled in ~$136mm in Q2 sales, up ~3% YoY, with YTD revenues of $269.3mm.
- TA instrument sales were $477.9mm, up from $469mm the year prior, but were down ~70bps in H1 FY’23 to $914mm. Management reported ~200bps of pricing in TA and other segments.
- Finally, service revenues came to $262.6mm and were up from $244.7mm last year.
The full breakdown of WAT’s H1 top line and the walk-through from Q2 FY’22–’23 are observed in Figure 2.
BIG Insights
2. Capital allocation and economic hurdles
In sizing up investment decisions, my formula is relatively simple. The top contenders are companies that aren’t capital-hungry (that is, don’t require swaths of capital to run the business or heavy additional investment to grow). These are exceptionally rare.
The other contenders are names that can, and do, reinvest piles of cash back into the business at attractive rates of return (above 12% is our threshold), repeating this year over year. Also rare.
All up, 3 factors determine this criterion:
- High returns (profits) on capital invested into the business.
- All cash incrementally redeployed also produces a high rate of earnings.
- Reinvestment runway (plenty of opportunities to invest).
In reality, all 3 factors are necessary for a long-term compounder. Those with points 1–2 in their arsenal, but without the reinvestment runway, typically return cash to shareholders. Those with a long reinvestment runway but poor economic prospects (low profits) are unlikely to create value. And so forth.
So company investment decisions are a core competency in the intrinsic value debate. These include dividends and buybacks along with CapEx, M&A and others.
In May, WAT finalized the acquisition of Wyatt Technology and its operations across Europe, France and the U.K. It paid $1.3Bn in cash for the transaction, financed through cash on hand and debt, and booked ~$900mm in accounting goodwill in doing so. Keep in mind, Wyatt reported FY’22 revenues of around $110mm—so WAT paid 11.8x trailing sales. Let that sink in. Wyatt’s revenues have compounded at 20% the last 3 years, however. Wyatt is in the light-scattering and field-flow fractionation business, quite a specialized domain. WAT’s rationale was that the purchase would expand its reach into large molecule applications.
Prior to Q2, WAT was in the camp of point (1) from earlier, and was buying back plenty of its stock. It made its own reinvestment runway with the Wyatt transaction. Critically, it has ceased buybacks and will use FCF in FY’23 to repay creditors, vs. rewarding equity holders (from the earnings call):
We maintain a strong balance sheet, access to liquidity and a well-structured debt maturity profile. This strength allows us the ability to prioritize investing in growth, including M&A and returning capital to shareholders…
…At the end of the quarter, our net debt position was approximately $2.3 billion, which is a net debt-to-EBITDA ratio of about 2.3. This represents an increase of $1.3 billion during the quarter, which is related primarily to the Wyatt acquisition. As we previously disclosed, we have temporarily suspended our share buyback program for the remainder of the year to use our free cash flow to delever the acquisition.”
The question is what to expect from this going forward (in terms of value creation for shareholders). For that, we can look to WAT’s recent history and make some inferences. For starters, it’s essential to know that WAT is a tremendously profitable enterprise. What’s critical to understand, is how it is investing, and what this is producing for its owners.
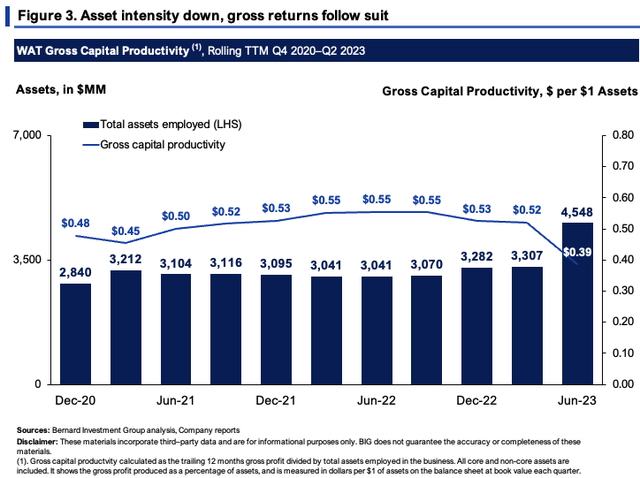
Figure 3 shows gross profitability as a percentage of total assets employed in the business on a rolling TTM basis since 2020. WAT was rotating ~$0.5–$0.55 per $1 of assets up to Q1 FY’23, which snipped to $0.39 on the dollar in Q2 post-acquisition. This is still high, but the drop is noted.
BIG Insights
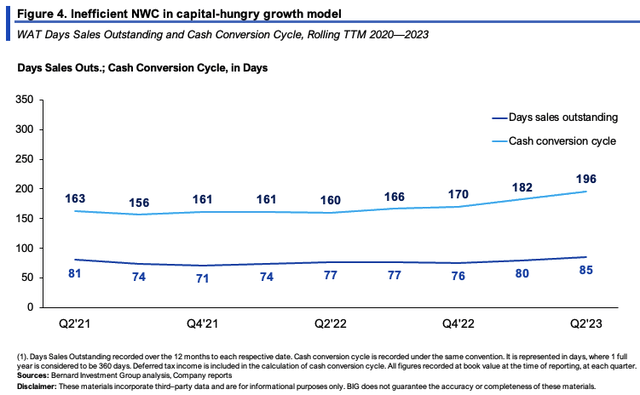
WAT’s rate of cash collection isn’t a standout feature. Each $1 investment in NWC is recycled to cash in 196 days, more than 30 days higher than 2020. This is trending higher as well. You’re looking at WAT turning over 1.86x each year at this pace—not efficient for a business selling instruments and the likes.
BIG Insights
- Incremental investment and return on existing capital
The investments WAT has put at risk towards business capital is tremendously profitable, as mentioned. For instance:
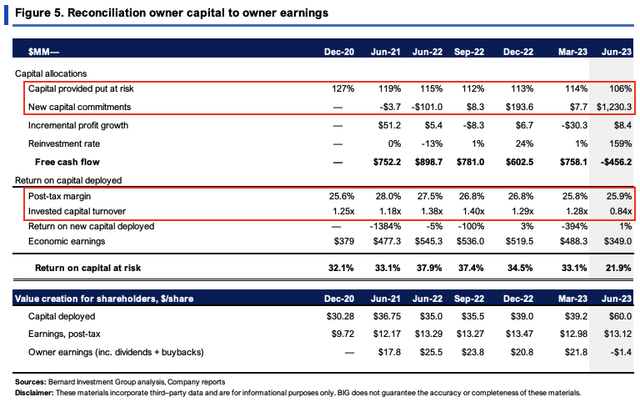
(i). It had $60/share invested in capital at risk in Q2, up from $30 in 2020. This includes the Wyatt transaction.
(ii). The $60/share produced $13.12/share in trailing earnings post-tax, otherwise, c.22% return on investment. Including buybacks, WAT has consistently spun off $17–$21/share to shareholders, excluding Q2.
(iii). The drivers of this are at the post-tax margin—26% last period, in line with historical range. This covers the light capital turnover of 0.8–1.2x, which factors sales compared to capital employed. WAT’s offerings are therefore profitable, and it likely enjoys consumer advantages, precisely why it could raise prices ~200bps last quarter, as mentioned earlier, due to its differentiated offerings.
This covers point (1) from our criterion from before. As to points (2) and (3)— the incremental returns and reinvestment runway—this is where WAT lacks economic value in my opinion.
Consider that:
- The $30/share invested from 2020–date has produced $3.40/share in NOPAT growth, just 11% return on investment.
- Managements FY’23 projections call for $930mm pre-tax income and this would net to $781mm post-tax at a 16% tax rate (WAT’s 3-year average). That’s a $1.23Bn investment to grow earnings $7.2mm, 0.6% return.
Difficult to conceive the transaction adding immense value if these are the kinds of expected growth rates moving forward.
BIG Insights
- Capital allocation in granular detail
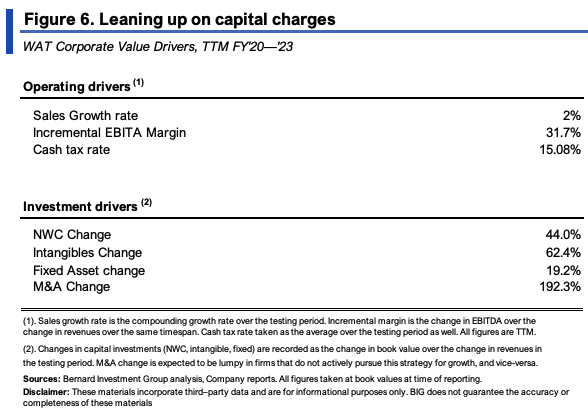
Turns out, WAT is a capital-hungry business after all. Figure 6 depicts this in greater detail for the last 3 years. Sales have grown at a 2% rate, on stable, and high operating margins of ~32%.
But each $1 in new sales required $1.25 of investment over this time ($3.17 per $1 of sales growth when factoring in Wyatt). Most of the capital has been allocated to NWC and intangibles, $0.44 and $0.62 on the dollar respectively. Issue is, the rates on these new investments have been sub-par as discussed earlier, despite the high returns on existing capital. So to grow sales by $1, WAT had to invest $1.25, violating the criterion from before. Torturing it in fact. This isn’t the kind of business that can grow the cash it can spin off to its owners, not in my view.
BIG Insights
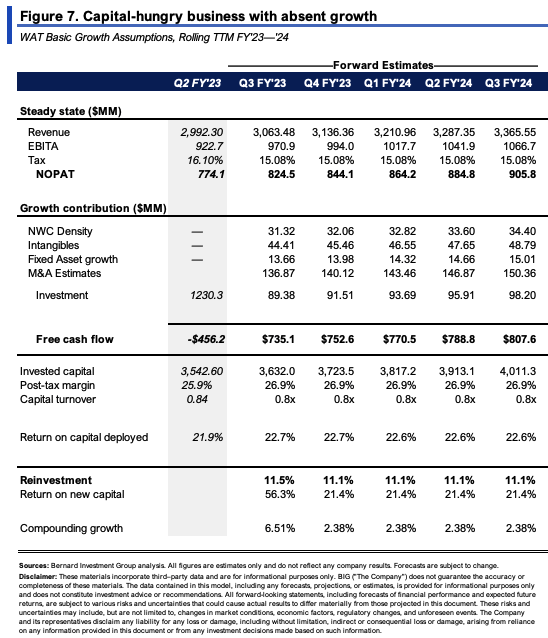
A fruitful exercise is to examine what this steady-state looks like going forward. M&A will be excluded, but if WAT continues to grow sales at an average 2% clip, at c.30% margins, it would likely require an $89–$98mm quarterly investment ($360–$420mm annualized) to get there. It could spin off $735mm–$800mm in FCF at this rate, but the incremental earnings growth would be confined. Under this model, it could compound its intrinsic value at an average 2.4% each period. To hit 3% sales guidance, the investment requirements would be $112–$127mm per quarter, on $716–$800mm of FCF.
BIG Insights
Valuation and conclusion
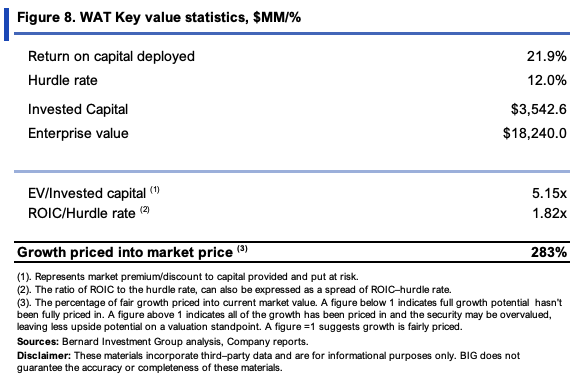
The stock sells at 22x forward earnings and 19.5x forward EBIT, 16% and 21% premiums to the sector respectively. WAT is priced at 5x EV/IC as well, which is attractive in the sense the market expects its investments to produce plenty of earnings growth. The market return on capital is therefore high. But, compared to what the business is actually doing, the growth looks to be well priced in.
BIG Insights
Which leads me to the estimates of implied value:
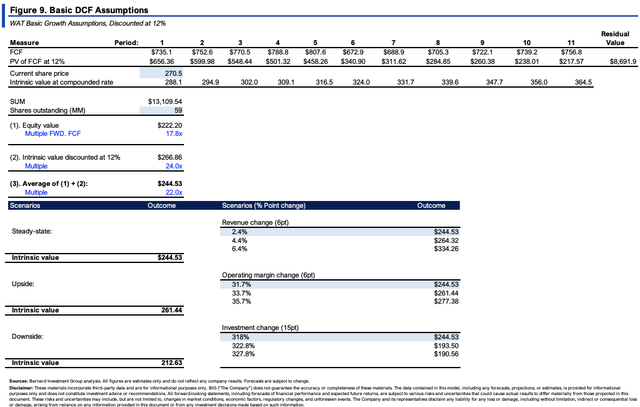
- Projecting the steady-state numbers in Figure 7 out to FY’28 and discounting back at the 12% hurdle rate, then, compounding the firm’s intrinsic value at the function of its est. ROIC and reinvestment rate, derives an average $244/share valuation.
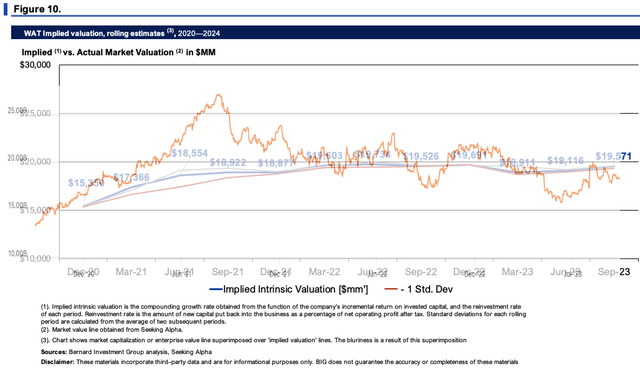
- In Figure 10, we see the market has been an accurate judge of fair value to date, and I get to a $19.5Bn market value at today’s value, in line with WAT’s current market value.
BIG Insights
In short, WAT is a classic example of a company with high returns on invested capital that throws off plenty of cash to shareholders, but lacks profitable incremental investment opportunities. Its Wyatt acquisition has yet to be well received by the market, and there’s no saying it will be. WAT also appears to be a capital-hungry business that needs plenty of cash just to grow sales and earnings a few points. Going forward, I’d be watching (1) the outcome of the Wyatt transaction, (2) profit growth compared to the new capital base, and (3) the market’s reception to both. Net-net, I now rate WAT a hold.
Read the full article here







Leave a Reply