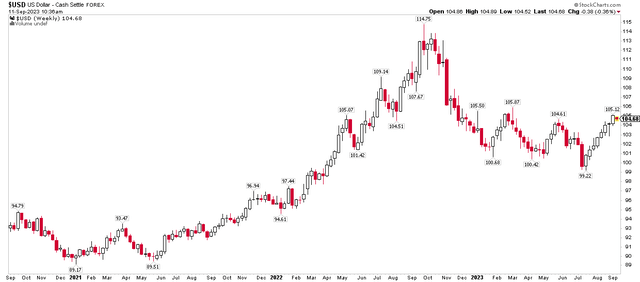
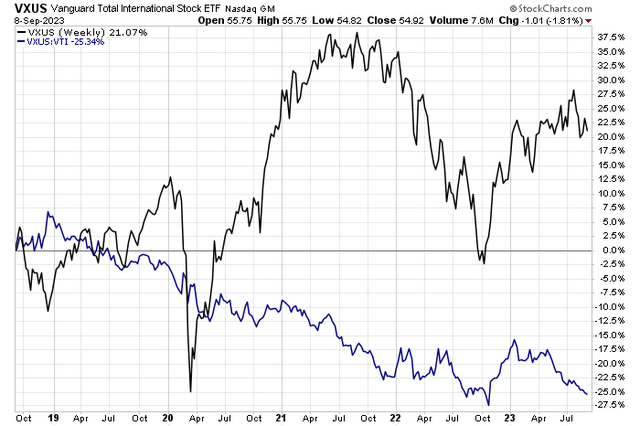
The US Dollar Index rose eight consecutive weeks heading into mid-September, the longest winning streak since 2015. After basing ahead of the Q2 earnings season along with interest rates, financial conditions have tightened somewhat, pressuring lower-quality firms and their stock prices. Indeed, many ex-US names have struggled since late July. With a rising greenback, foreign stocks have underperformed their domestic peers. The relative performance chart below highlights that the Vanguard Total International Stock Index Fund ETF (NASDAQ:VXUS), compared to the Vanguard Total Stock Market Index ETF (VTI), is now back toward all-time relative lows as investors continue to shun an overweight to overseas equities.
It has been more than six months since I last reviewed VXUS, and I reiterate my hold rating, but we are nearing a very bullish part of the calendar.
US Dollar Index Jumps in Q3
Stockcharts.com
VXUS Near All-Time Relative Lows vs US Stocks
Stockcharts.com
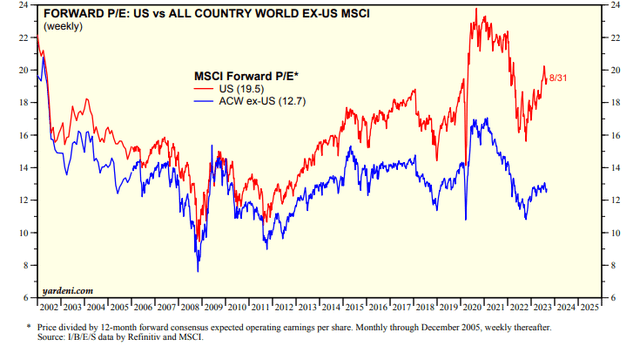
International Stocks Continue to Trade Cheap
Yardeni.com
According to the issuer, the Vanguard Total International Stock ETF (VXUS) aims to mirror the FTSE Global All Cap ex-US Index’s performance, which gauges the returns of non-US companies. It provides broad investment exposure to both developed and emerging foreign equity markets while employing a passive management strategy that replicates the index.
VXUS is a very low-cost product to capture foreign equity exposure – its annual expense ratio is 0.07% while liquidity is strong with average volume of 2.04 million daily over the past three months and a 30-day median bid/ask spread of just two basis points. The valuation of VXUS is what many diversified investors find appealing right now. The forward non-GAAP price-to-earnings ratio of the ACWI ex-US index is under 13, barely above its late 2022 lows while the US stock market is much pricier with a multiple closer to 20. That valuation gap is not far from the widest in recent history.
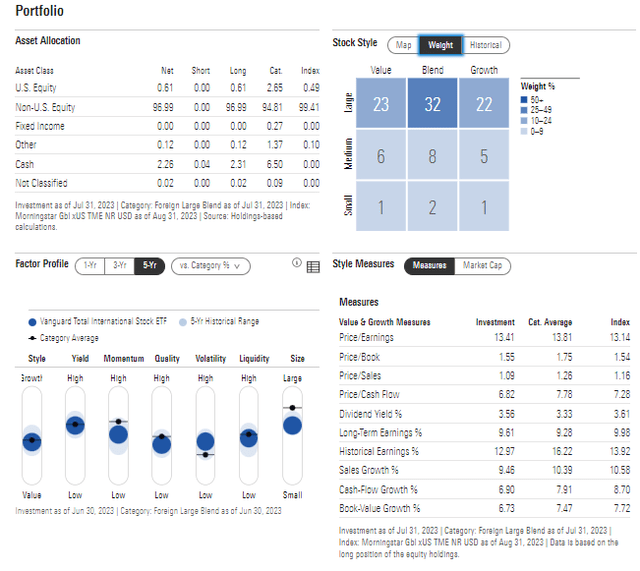
Of course, much of the valuation difference can be explained by the composition of the global ex-US market compared to VTI. VXUS is close to being balanced between growth and value, whereas domestic equities, on a weighted-average basis, are much more growth-oriented due to a high allocation to the Information Technology and tech-related sectors, which command higher P/Es. VXUS, which debuted in 2011, continues to sag both relative to the US and, more recently, on an absolute basis.
VXUS: Portfolio & Factor Profiles
Morningstar
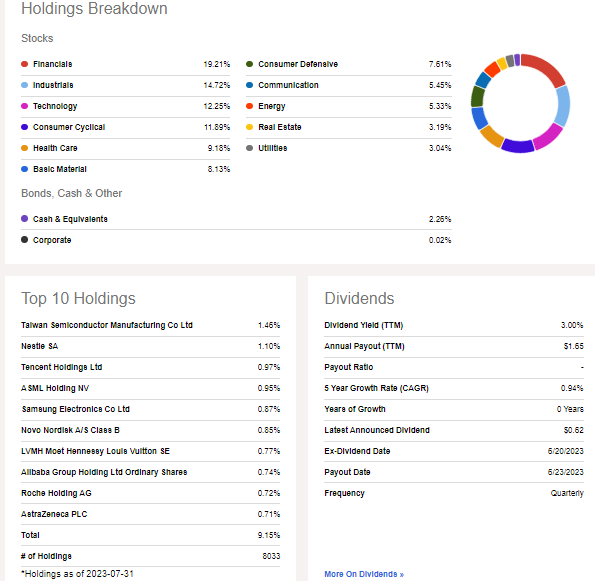
Digging into the portfolio, there is more sector diversification with VXUS compared to other US-focused index funds. Notice in the view below that no single area comprises more than 20% of the ETF. The value-oriented Financials and Industrials sectors are the largest while Technology is about 15 percentage points under the weight seen in the S&P 500. What is also intriguing about VXUS today is that it’s also balanced in terms of single-stock exposure.
While the SPX has significant weights in the mega-cap 7, no individual company represents more than 1.5% of VXUS. So, if the Magnificent Seven retreat, then VXUS could outperform. Aside from the positions, the fund yields 2% on a trailing 12-month basis while its median market cap size is $33.5 billion with an EPS growth rate of 9.9%. The PEG, therefore, is barely above 1 – which is appealing on valuation (11.8x P/E, per Vanguard as of July 31, 2023). The S&P 500’s PEG is about 1.9 today, for perspective. VXUS is 25.4% Emerging Markets with the rest of the allocation being primarily Developed Markets. Japan is the biggest country weighting at 15.6%.
VXUS: Portfolio Details
Seeking Alpha
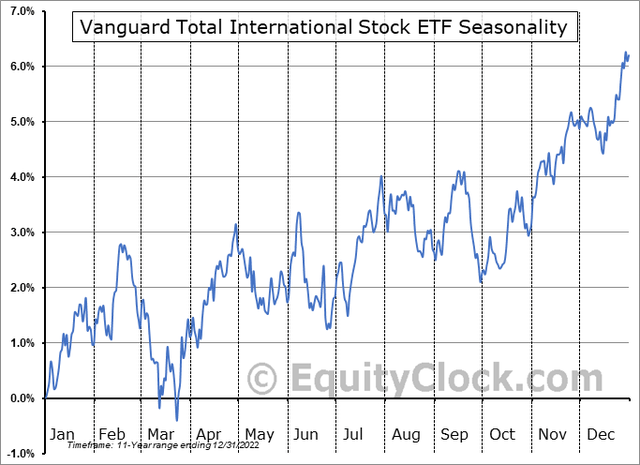
Seasonally, VXUS tends to turn a bullish corner in late September, according to data from Equity Clock. The back half of this month, however, is notoriously volatile with bearish price action, so being nimble as an active investor right now is prudent, but we are getting very close to prime seasonal strength.
VXUS: Bearish Latter Half of September Before Bullish Trends Often Ensue
Equity Clock
The Technical Take
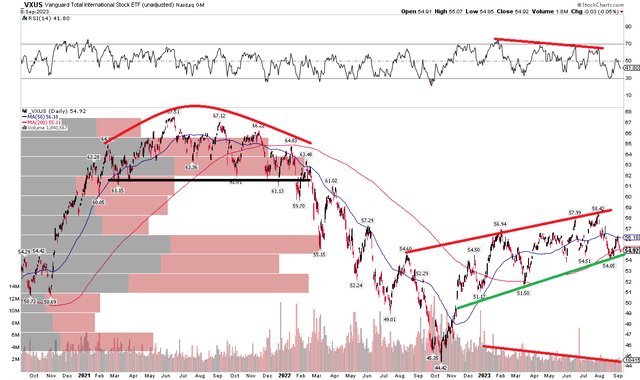
With a continued attractive valuation, but weak relative strength, the technical picture is lukewarm. Notice in the chart below that VXUS put in a bearish rounded top pattern in 2021, culminating in a low last October at $44.42 – a 35% bear market. After a series of higher highs and higher lows over the past 11 months, there is an encouraging recent trend, but the RSI momentum index at the top of the graph illustrates that it has been a soft move.
The RSI gauge has printed lower highs in a bearish divergence pattern as volume has waned. Before issuing a buy rating, I would like to see both momentum and volume improve. The long-term 200-day moving average, meanwhile, has flattened as VXUS has consolidated since early in the year when I reiterated my hold rating.
Overall, support is found in the low $50s while resistance could come into play both near $58 and at the 2021 range-lows around $62.
VXUS: Weak Uptrend, Overhead Supply (Resistance) From 2021
Stockcharts.com
The Bottom Line
I continue to like the valuation of ex-US stocks, but I would like to see better technical readings from VXUS before issuing a buy rating. On a positive note, bullish seasonal trends ensue at the end of the month.
Read the full article here


Leave a Reply