ETF Screening
The Vanguard Value ETF (NYSEARCA:VTV) is a two-decade-old passively managed product that offers coverage to over 340 stocks (mainly large-cap stocks) that exhibit suitable “value” qualities. Whilst constructing its portfolio, VTV’s tracking index employs a multi-factor model that combines five different value metrics on any given stock (stocks that comprise the top 85% of the CRSP US Total Market), namely-
the inverse P/Book value The inverse forward P/E The inverse historical P/E The current dividend yield The inverse P/sales
Whilst determining a composite value score, note that greater weightage (two-thirds) is assigned to the first three value metrics (the inverse readings of the P/BV, and the forward and historical P/Es) with the dividend yield and the inverse P/S receiving an aggregate lower weight of only one-thirds.
VTV vs. Other Value Stalwarts
To gauge VTV’s standout qualities we thought it would be fitting to measure it against other prominent options in this space. Thus, in this comparative study, we’ve looked at two other 4-star rated ETFs (by Morningstar), which are incidentally also considered to be two of the oldest options in this space.
As the name suggests, the first peer- the SPDR Portfolio S&P 500 Value ETF (SPYV) focuses on around 400 undervalued stocks (relative to the broader markets) from the S&P500 index and has been around since late September 2000. The second option- the iShares Core S&P U.S. Value ETF (IUSV), is the oldest out of the lot, having been around since July 2000. It also spreads its tentacles across a wider pool of value stocks (over 700 stocks), and thus also offers slightly higher exposure to mid and small-caps (VTV and SPYV don’t dabble with small-caps).
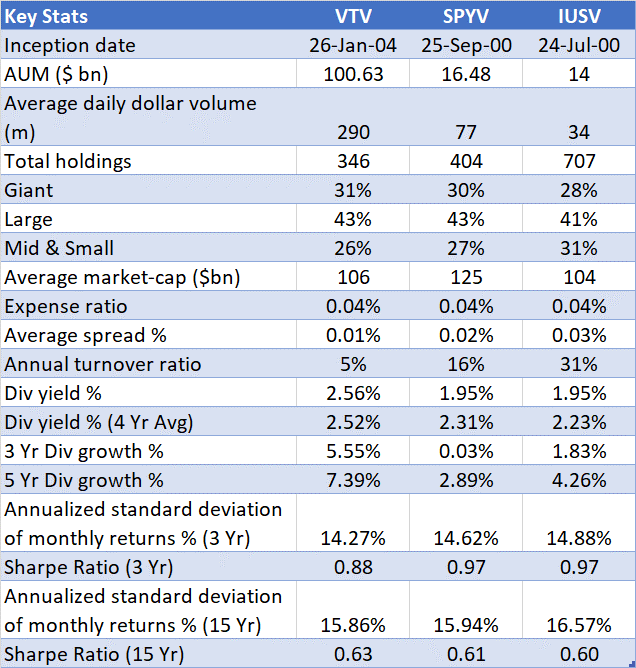
What’s rather telling is that despite coming to the bourses only three and a half years after its two peers, VTV has comfortably managed to accumulate a larger chunk of AUM over time (over 6-7x higher than SPYV and IUSV). Its popularity as a preferred trading play can also be gleaned from the daily dollar volumes witnessed in this counter. VTV’s average daily dollar volumes of nearly $300m are almost 4x as much as what SPYV witnesses, and over 8x as much as what IUSV witnesses.
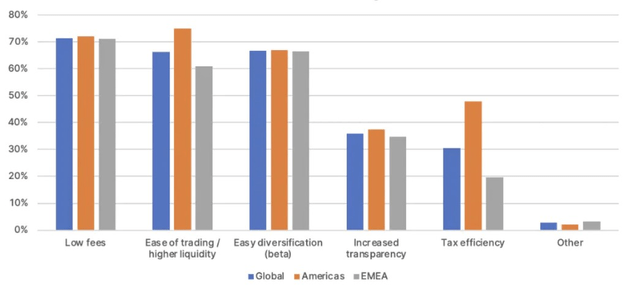
Prima facie, VTV’s enormous popularity is a curious phenomenon, as global studies have shown that lower fees tend to be the primary driver in attracting flows to an ETF, and in this study, we note that VTV doesn’t have an edge, with all three options maintaining an identically low expense ratio of just 0.04%.
ETF Central
However, also note that in the Americas region, the dominant swing factor is higher liquidity, and here VTV scores very highly. Besides its stupendous daily dollar volumes, you also have best-in-class average spreads of just 0.01% (the average bid-ask variance over 45 days as a %).
We believe investors are also attracted by the relatively superior income profile on offer. Whether it’s the short or medium-term, VTV’s dividends have grown at 6-7%, a much superior pace than what the other two peers have grown their dividends. Crucially, if one were to get in now, not only would you be getting a better yield than what the other alternatives offer (+60bps), you’d also be getting a marginally positive differential vs the 4-year average (something which the other ETFs can’t boast of).
YCharts
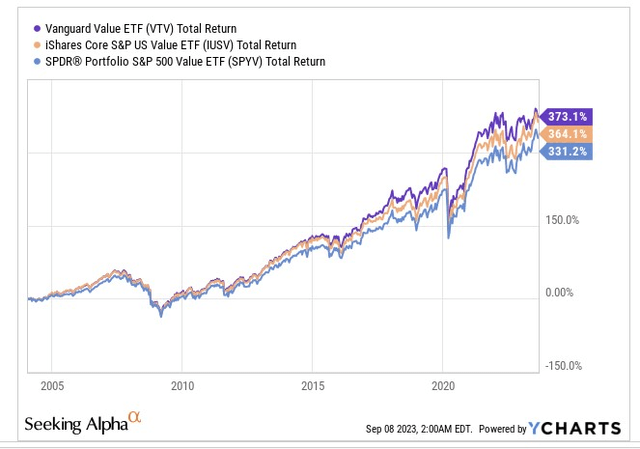
Even from a return angle, there’s quite a bit to like; since its inception in early 2004, the VTV has managed to outperform both SPYV and IUSV. However, just looking at returns in isolation won’t be sufficient. It’s also key that we gauge the risk profile of these portfolios over time, and also consider whether they have been able to generate a suitable threshold of excess returns for the risk they take.
The results tell us that, be it over the short-term (3 years) or the long-term (15 years), VTV’s risk profile has been marginally lower (the annualized standard deviation figures). Whilst none of these products have been able to provide ample excess returns (returns over the risk-free rate) that justify the level of risk they take (all of them have sub 1x Sharpe ratios), VTV’s Sharpe ratio is the best over 15 years. In recent years though, the quality of stock-picking ought to be questioned, as despite maintaining a lower volatility profile (annualized standard deviation of monthly returns over 3 years), its Sharpe ratio has lagged both its older peers.
YCharts, Seeking Alpha, ETF.com
Financial Sector Risk
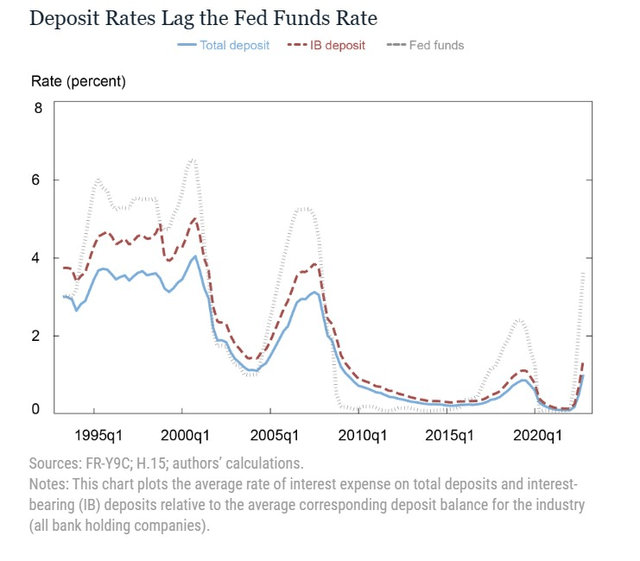
VTV’s sector tilt is mainly towards US financials, and this is a sector that is currently not quite in the best position to flourish. So far, the Fed’s rate hiking spree has worked well for the net interest margin profile of most banks, but we remain doubtful if this narrative has legs, as higher deposit rates which typically lag Fed Funds rates start leaving an unfavorable impact on NII (Net Interest Income) growth going forward. Besides that, a slowing consumer environment will also leave an adverse mark on loan growth.
NY Fed
During this part of the economic cycle, it is all but likely that credit quality will worsen, and banks are likely to stash a greater chunk of their operating profits towards provisions. The image below highlights how aggregate provisions for credit losses have been sequentially growing over time
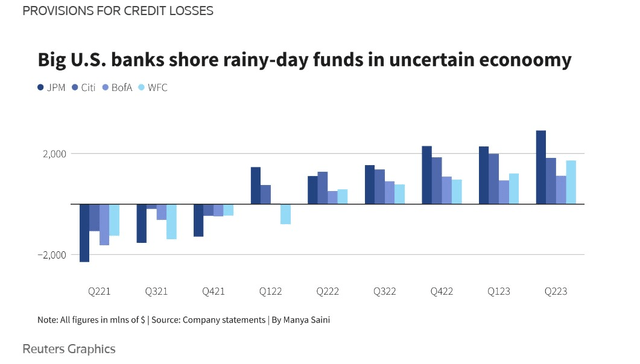
Reuters
The latest data also shows that banks are becoming even more conservative and stashing up cash on their balance sheets. On a YTD basis, cash assets stood at over $3.36 trillion, which is above pre-pandemic levels.
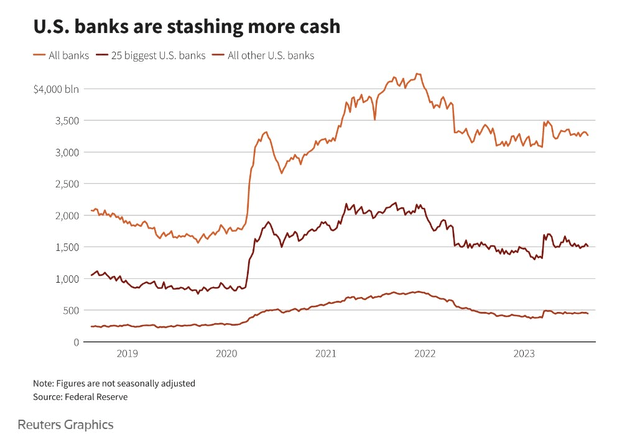
Reuters
Some investors may suggest that this excess cash could likely be deployed via higher distributions, but do consider that the FDIC is the midst of imposing higher capital standards for banks and one would think that these banks are preparing to deal with that outcome.
Closing Thoughts
We know that VTV predominantly focuses on undervalued stocks, so it shouldn’t come as any great surprise to note that VTV’s weighted average P/E of 15x, represents a 25% discount to the corresponding multiple of the S&P500. On the relative strength charts as well, we can see that the value stocks of the S&P500 look ripe for some mean-reversion once again, with the current relative strength ratio around 14% off the mid-point of the long-term zone.
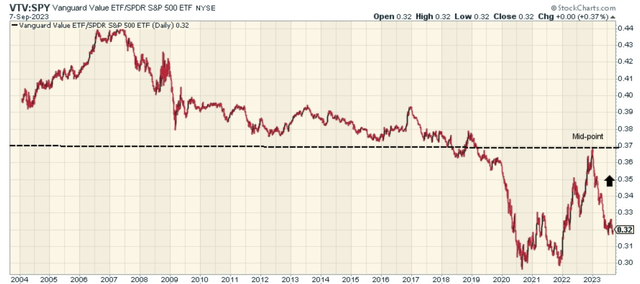
Stockcharts
A similar takeaway to consider when you compare value stocks to growth stocks. Crucially also consider that the valuation differential between value stocks (VTV) and growth stocks (VUG) is currently a whopping 50%! This mammoth valuation differential could have been justified if growth stocks were poised to deliver exceptional earnings growth, but data from Morningstar shows that VUG’s portfolio will likely only deliver long-term earnings growth of 13%, only around 400bps more than VTV’s expected earnings growth.
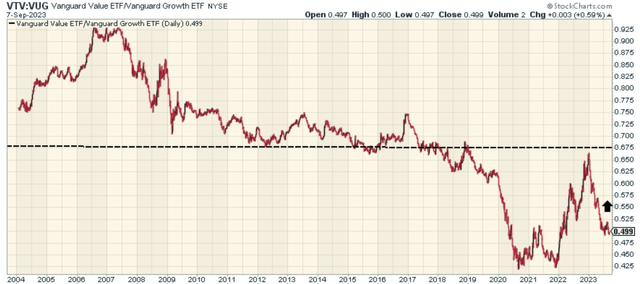
Stockcharts
Read the full article here


Leave a Reply