September has seasonally been a volatile month for stocks. Subsequently, the months of October, November, and December are more conducive for the bulls.
That said, we are not seeing a rush into defensive sectors at the moment, such as utilities and low-volatility stocks. In addition, there is no widening of credit spreads presently, which means the market is not experiencing credit stress.
However, how I would position myself in the near-term would be to focus on mega-cap, liquid technology stocks. This is where the money is flowing into in the past few days, at the expense of smaller-cap stocks.
A rotation out of mega-caps into higher beta, smaller-cap names could be a better play only towards the tail-end of September, when seasonality favours risk-taking.
First, let us take a look at VIX seasonality. We can see that volatility tends to climb and peak in September, before dropping as we approach year-end. So far, 2023 has played out largely in line with this seasonality.
Nomura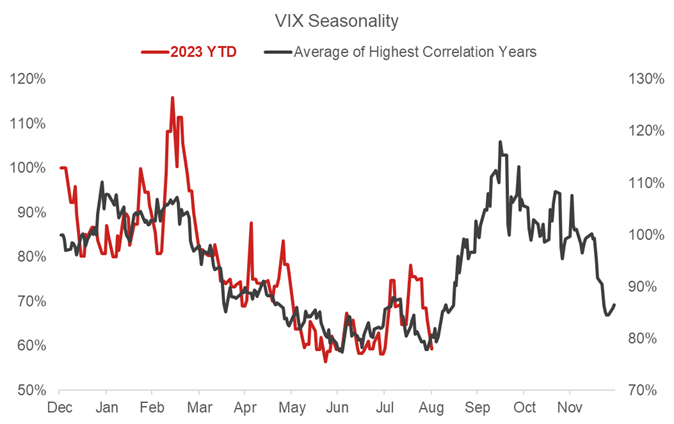
Next, when we look at the S&P 500 seasonality, we can see that stocks can rise in September, but they tend to drop just as quickly. In essence, September is a volatile month. The good news is that stocks tend to bottom towards late-September to early-October, before closing the year on a strong note.
EquityClock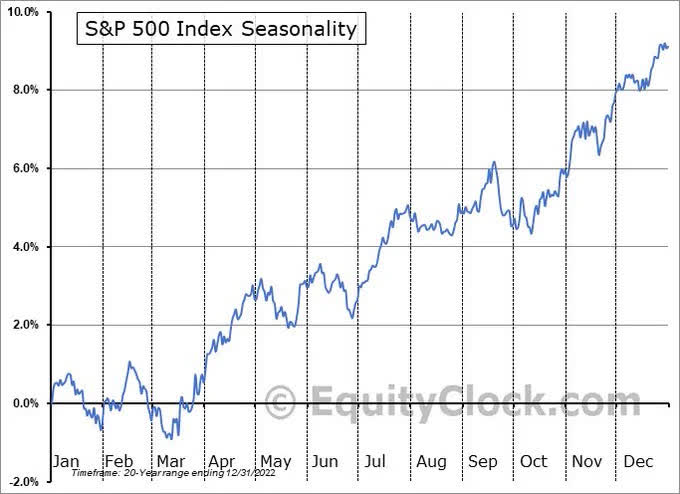
At present though, the markets are holding up decently. High volatility stocks (SPHB) remain in favour against low volatility stocks (SPLV), as seen from the SPHB / SPLV ratio below.
Weekly Chart: SPHB/SPLV
Tradingview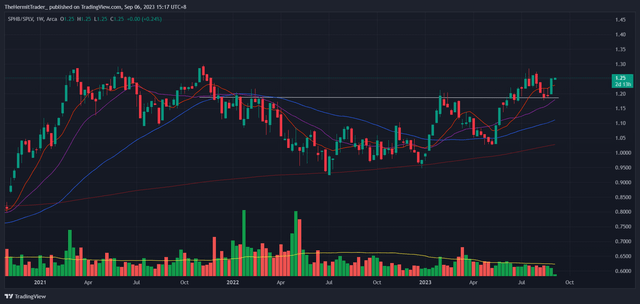
Defensives are also not in favour, with the S&P 500 (SPY) at new highs relative to utilities (XLU), as seen from the SPY / XLU ratio below. Investors tend to flood into defensives when the market is experiencing stress, but this has not happened (yet).
Monthly Chart: SPY/XLU
Tradingview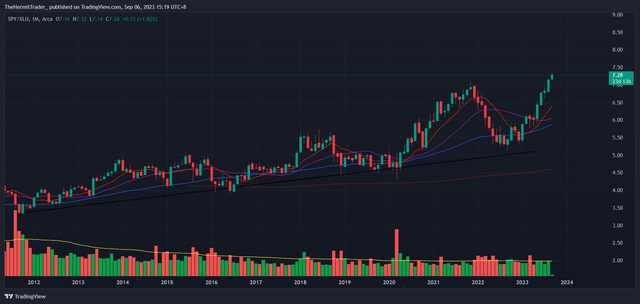
We are also at the brink of a multi-year breakout in high yield bonds (HYG) relative to Treasury bonds (TLT). This means credit spreads are widening, with investors comfortable with high yield bonds. The markets are not sniffing out a credit event at the moment.
Monthly Chart: HYG/TLT
Tradingview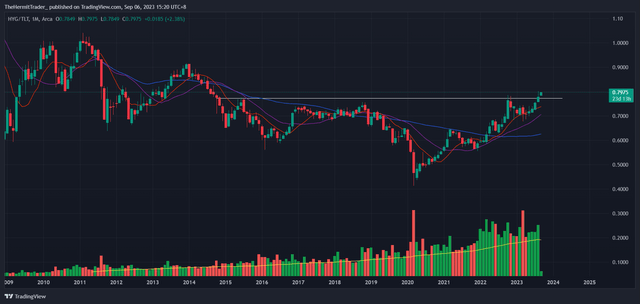
Given the factors in play, the market appears to be holding its ground at the moment. However, seasonality does matter, and we want to be guard against a spike in volatility, which tends to occur this time of the year.
A middle ground approach would be to buy into mega-cap, liquid technology stocks. They offer the type of liquidity that institutions like, in the event they have to rapidly sell their positions.
We may also observe from the ratio of the Nasdaq 100 (QQQ) against the Russell 2000 (IWM) below that price has made a new high recently. This means that the mega-cap stocks are outperforming the broad market – using IWM as a proxy. Money is flowing into mega-caps at the expense of smaller cap stocks.
Daily Chart: QQQ/IWM
Tradingview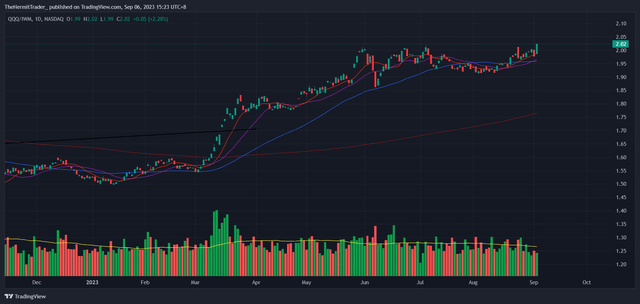
With the money flowing into mega-cap institutional-grade names, we can either buy into an ETF or individual names.
If you would like to buy into an ETF to avoid individual name selection, then the UltraPro QQQ ETF (NASDAQ:TQQQ) could be a good choice.
The ETF aims to replicate the Nasdaq 100 Index, which is heavily weighted towards mega-cap technology stocks.
The ETF comes with 3x leverage. As such, if you put in $1000 into this ETF, the actual position size would be $3000.
The top holdings in the ETF include mega-cap technology stocks, as shown below. These include names such as Microsoft (MSFT), Apple (AAPL), NVIDIA (NVDA), Amazon (AMZN), and Tesla (TSLA). As mentioned, these are the types of liquid stocks that large institutions have on their radar.
Proshares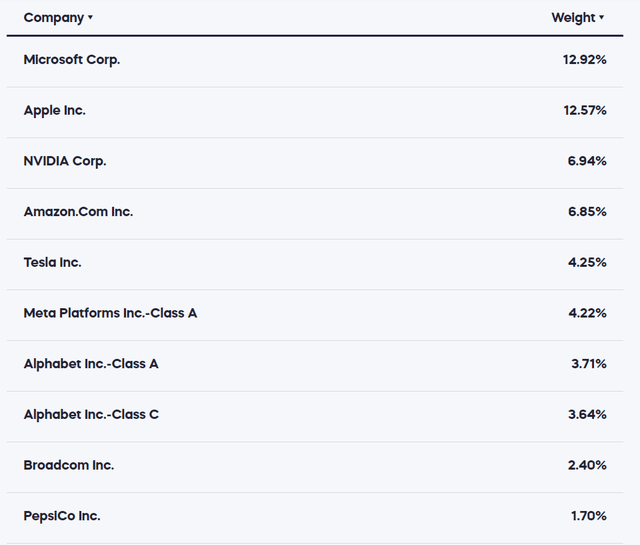
Why I prefer TQQQ over unleveraged ETFs such as QQQ is because brokers such as Interactive Brokers (IBKR) are paying up to 4.83% on spare USD cash in the account. This is possible due to today’s high interest rate environment, and a 3x leveraged position would take up 1/3 of the spare cash compared to an unleveraged position.
The expense ratio of TQQQ is 0.86% p.a., so the investor is paid for having spare cash in the brokerage account. Of course, this depends on the type of brokerage account you are using.
Interactive Brokers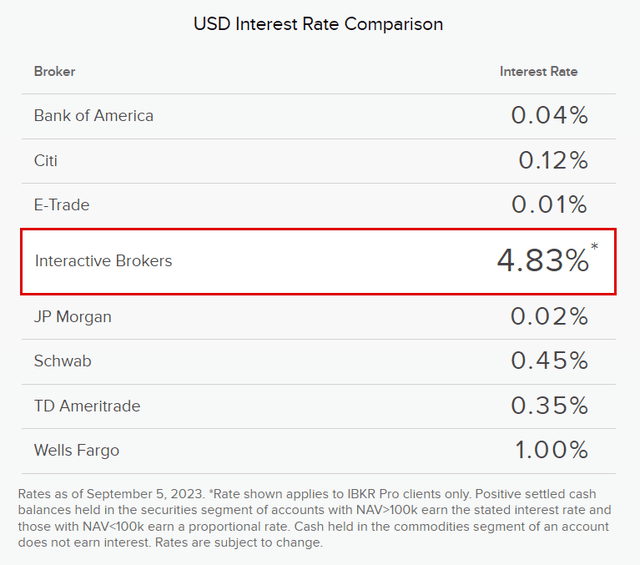
The TQQQ ETF is a liquid ETF, with average volume at 87m shares traded daily, or $3.5b in terms of daily dollar traded volume. Overall AUM on the ETF is close to USD 19b.
Proshares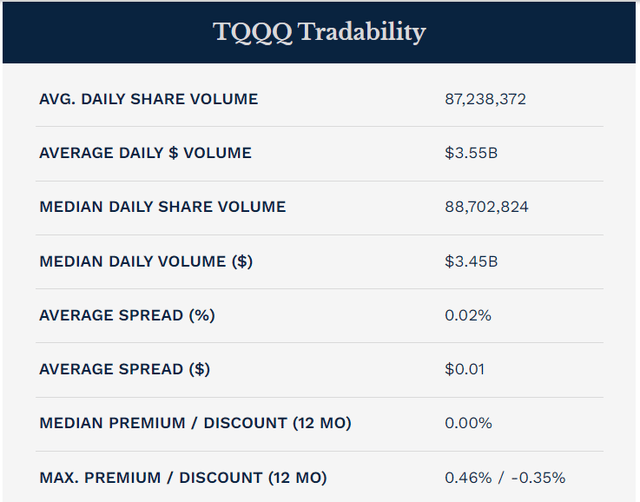
On the daily chart, TQQQ is resting right at the neckline of a mini base, and looks on the verge of breaking out higher. It is also trading above its key moving averages (10, 20, 50, 200 day), which means less overhead resistance if it breaks out higher.
Daily Chart: TQQQ
Tradingview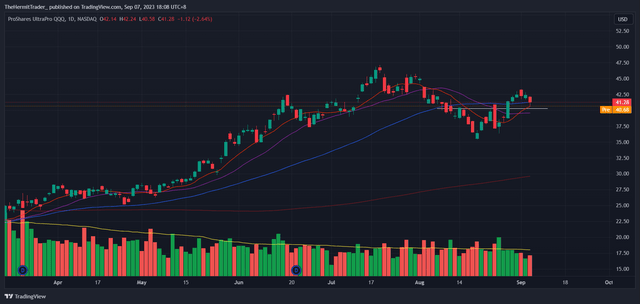
To end off, I will cover the risks of investing in leveraged ETFs. These are not meant to be buy and hold products, as they suffer erosion of value over time.
Quoting ETF.com, the reason for this is that the leveraged ETF is designed to provide multiple returns of the underlying asset on a daily basis. The compounding effect of daily returns means that losses in the ETF are magnified over time. If the underlying asset experiences high volatility, the volatility drag will be more significant, resulting in higher losses for the leveraged ETF.
As such, leveraged ETFs work best with short to medium term time frames.
In addition, do note that because of the 3x leverage, the investment amount should be adjusted accordingly to reflect the leverage. An intended $3000 investment into the Nasdaq 100 should be sized as a $1000 investment into TQQQ.
Read the full article here




Leave a Reply