A bank is a place that will lend you money, if you can prove that you don’t need it. – Bob Hope
I’ve talked a lot in recent weeks about heightened risks for a potential credit event in markets and how Technology, because of the disposition effect whereby people sell winners before losers when faced with uncertainty, could be hit the hardest. What about Financials though? After all, a credit event should most hit banks, right?
Maybe not – maybe far more negative news is discounted in the Financials sector than other areas of the marketplace. And if I’m right, there’s a specific way I think to play the sector regardless of market volatility with solid funds like VFH.
Launched by Vanguard on January 26, 2004, the Vanguard Financials ETF (NYSEARCA:VFH) is a passively managed ETF, designed to provide broad exposure to the Financials segment of the equity market. VFH aims to replicate the performance of the MSCI US Investable Market Financials 25/50 Index before fees and expenses. It has become a popular choice for both retail and institutional investors, thanks to its low costs, transparency, flexibility, and tax efficiency.
Understanding the VFH ETF Structure
VFH is one of the larger ETFs out there, with assets exceeding $7.5 billion. It operates on a full-replication strategy when possible and uses a sampling strategy to approximate the index’s key characteristics if regulatory restrictions prevent full replication. The fund stays fully invested, and its low expenses minimize net tracking error.
The MSCI US Investable Market Index (IMI)/Financials 25/50 measures the investment return of stocks in the financial sector. This index offers broad representation of the target sector across large-, medium-, and small-cap companies. It includes stocks of U.S. companies within the financials sector involved in activities such as banking, mortgage finance, consumer finance, specialized finance, investment banking and brokerage, asset management and custody, corporate lending, insurance, and financial investment.
The Cost Aspect of VFH
A critical factor for investors to consider is the ETF’s expense ratio. VFH’s annual operating expenses are 0.10%, making it one of the least expensive products in the space. Lower cost products generally yield better results than those with higher costs for passive strategies, assuming all other metrics remain consistent. It also has a 12-month trailing dividend yield of 2.12%.
Comparing VFH with Other ETFs
VFH isn’t the only major Financials ETF out there. Investors could also consider other ETFs in this space, like the iShares U.S. Financials ETF (IYF) and the Financial Select Sector SPDR ETF (XLF). IYF tracks the Dow Jones U.S. Financials Index, with an expense ratio of 0.39%. On the other hand, XLF tracks the Financial Select Sector Index charges an expense ratio of 0.10%. All are good proxies but Vanguard does have the benefit of being known for passive low-cost index funds.
VFH’s Performance History
VFH’s performance history is a testament to its potential as a reliable investment. As of June 30, 2023, here’s how VFH has performed against its benchmark. We can see it tracks fairly well after fees.
| Time Period | Net Asset Value (NAV) Return | Market Price Return | Spliced U.S. Investable Market Financials 25/50 Index |
|---|---|---|---|
| Quarter | 4.89% | 4.88% | 4.92% |
| Year to Date | -0.69% | -0.69% | -0.64% |
| 1 Year | 8.01% | 7.98% | 8.04% |
| 3 Years | 14.95% | 14.93% | 15.03% |
| 5 Years | 6.23% | 6.22% | 6.32% |
| 10 Years | 9.67% | 9.66% | 9.77% |
| Since Inception | 4.71% | 4.71% | 4.79% |
(Note: All figures represent average annual returns, except figures for periods of less than one year, which are cumulative returns.)
Breakdown of VFH’s Holdings
The ten largest holdings of VFH account for 43.6% of its total net assets. The top three are Berkshire Hathaway Inc. at 8.1%, JPMorgan Chase & Co. at 7.8%, and Visa Inc. at 6.3%. The remaining seven companies in the top ten are Mastercard Inc., Bank of America Corp., Wells Fargo & Co., S&P Global Inc., American Express Co., Goldman Sachs Group Inc., and Morgan Stanley.
In terms of market capitalization, VFH is heavily weighted towards large-cap stocks, with 66.1% of its portfolio in this category. Medium/Large Cap stocks make up 6.4%, Medium Cap stocks 13.0%, Medium/Small Cap 5.8%, and Small Cap 8.7%.
Diversified Banks form the largest subindustry diversification of VFH, accounting for 19.2% of common stock. This is followed by Transaction & Payment Processing Service at 18.5%, Multi-Sector Holdings at 8.3%, Financial Exchanges & Data at 8.2%, and Asset Management & Custody Banks at 7.8%.
So What’s The Trade?
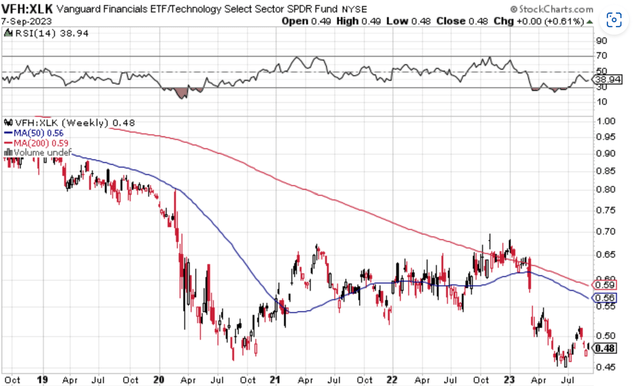
The Vanguard Financials ETF offers a diversified, low-cost option for investors seeking exposure to the broad financials sector. But it’s not something I would make a directional bet on now given what I believe is heightened risk for a credit event. I think there’s an interesting pairs trade here however which may seem counterintuitive, but is ultimately a play on relative strength. If we look at the price ratio of VFH relative to the Technology XLK ETF, it looks like Financials may have bottomed relative to AI mania in early July and could be in an upswing of relative strength.

Stockcharts.com
The trade here is simple. If you believe as I do the risk is elevated for a credit event, then you want less directional exposure, so perhaps the thing to do here is a dollar neutral spread trade of going long Financials, short Technology. That way you mimic the price ratio above independent of what happens next to the stock market.
Read the full article here


Leave a Reply