Introduction
Verallia (OTCPK:VRLAF) is one of the largest producers of glass containers in the world. I discussed this company earlier this year here on Seeking Alpha, and the ESCI portfolio had a long position at an average price in the low to mid 20 EUR range. I sold my entire position and exited the position in the ESCI portfolio as well, as I thought the company was reaching fair and full value. But after seeing the very strong set of results in the first half of this year, it is now starting to look like I may have sold too early.
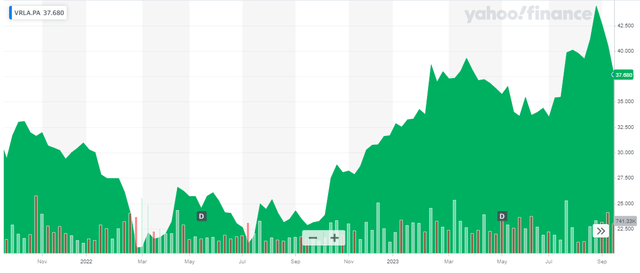
But maybe I’m getting a second chance. Despite the strong H1 results, the share price lost about 15% in the past three weeks as the financial markets weakened a little bit.
Yahoo Finance
Verallia’s primary listing is on Euronext Paris, where it is trading with VRLA as its ticker symbol. There are currently approximately 117M shares outstanding (after deducting the treasury shares) for a total market capitalization of 4.4B EUR. Employee ownership is approximately 4.23%. The average daily volume in France is just over 130,000 shares, making it the most liquid listing of Verallia.
As the company reports its financial results in Euro and trades in Euro, I will use the EUR as base currency throughout this article.
The EBITDA and free cash flow are stronger than I had anticipated
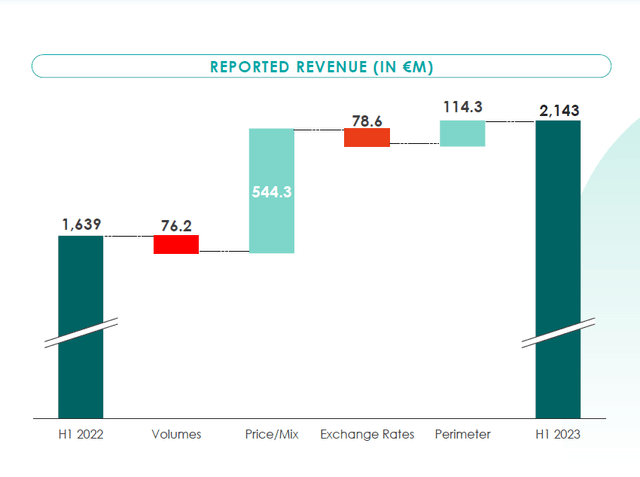
The H1 results were strong. Much stronger than I had anticipated. And although the volumes decreased (they picked up again in the second quarter, but volumes were soft throughout the semester), Verallia’s pricing power was exceptionally strong. This doesn’t mean the company is suffocating its customers: as the impact of inflation on the production costs was lower than anticipated, Verallia has already launched a series of price reductions.
Verallia Investor Relations
But needless to say, a total organic revenue increase of almost 29% in the first half of the year is pretty spectacular. Volume decreases and FX headwinds weighed on the result, but the price hikes and the acquisition of Allied Glass in the second half of last year (which is now represented in the ‘perimeter’ component of the revenue bridge) were the main drivers of this volume growth.
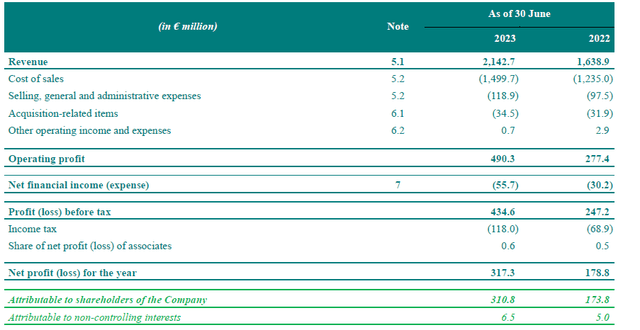
And of course, the higher revenue definitely boosted the bottom line result. While the cost of sales increased, they increased by just over 21% and although that is a high number, the margins actually improved as Verallia’s price hikes mitigated the impact of the higher input costs. As you can see below, there also was a 20% SG&A increase, but the acquisition-related costs remained stable and this boosted the operating profit to 490M EUR. That’s a 77% increase.
Verallia Investor Relations
Unfortunately the company also had to deal with higher interest and finance expenses but with a pre-tax profit of 435M EUR and a net attributable income of just under 311M EUR representing an EPS of 2.65 EUR per share, there is no reason to be disappointed at all.
As you may know by now, I prefer to look at a company’s cash flows before deciding to make investments. Generating an ‘accounting profit’ is nice, but I like to see the paper profits being converted into hard cash.
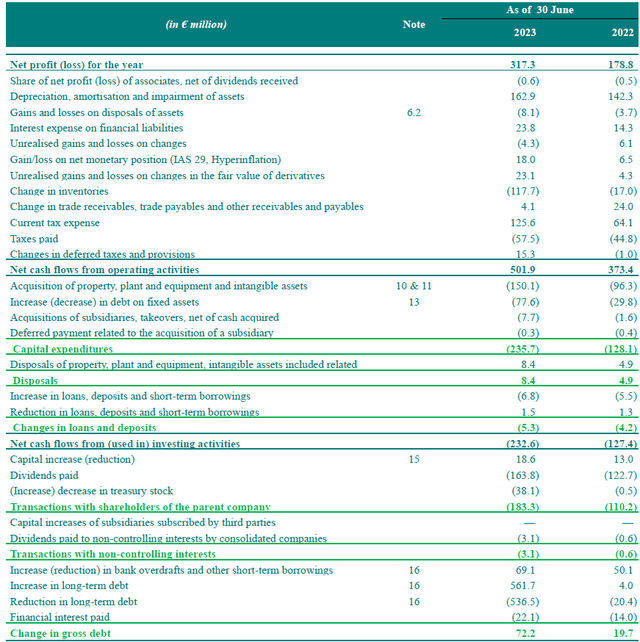
The reported operating cash flow in the first half of the year was approximately 502M EUR, but this includes a tax payment of just 57.5M EUR, although the income statement indicates the relevant taxes were 125.6M EUR during the semester. The reported operating cash flow also includes a 113M EUR investment in the working capital position, which means the adjusted operating cash flow was 547M EUR and 525M EUR after taking the interest payments into consideration. There should also be about 10M EUR in lease payments, resulting in an adjusted operating cash flow of 515M EUR.
Verallia Investor Relations
The total capex was about 150M EUR, which means the underlying free cash flow was approximately 365M EUR. Approximately 360M EUR of this result was attributable to the shareholders of Verallia, and this represents about 3.08 EUR per share.
That is quite substantially higher than the EPS of 2.65 EUR and there is a relatively easy explanation for that: the income statement contained about 33M EUR in non-cash net losses on, for instance, derivatives and hyperinflation-related issues.
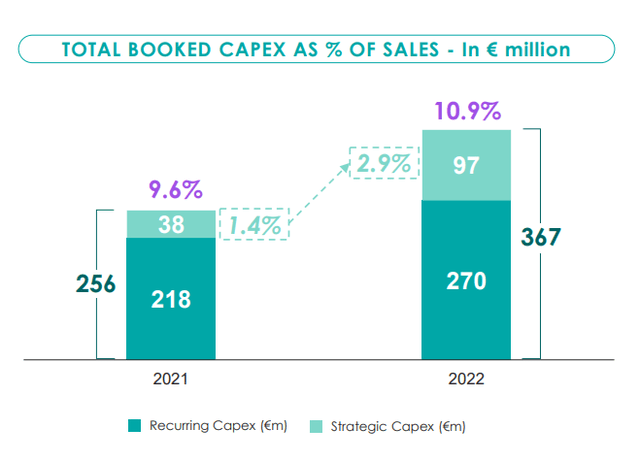
And of the 150M EUR in capital expenditures, 57M EUR was related to growth investments and the total sustaining capex was just 93M EUR. While the sustaining capex is higher than in the first half of last year, let’s keep in mind the total capex and sustaining capex is still weighed towards the second half of the year. In 2021, the sustaining capex was 218M EUR and this increased to 270M EUR in 2022, so it’s perhaps ‘safe’ to just continue to use the 150M EUR as pro rata sustaining capex. Verallia is guiding for an average sustaining capex of 8% of the revenue.
Verallia Investor Relations
The company is now guiding for a full year EBITDA of 1.1-1.25B EUR and considering the H1 EBITDA was already 659M EUR, I think it’s safe to aim for the higher end of that guidance. Using a base case scenario with a 1.2B EUR EBITDA would indicate a 15% EBITDA decrease in the second semester. On the conference call, management also sounded optimistic.
First of all about our guidance, we would just like to say that we are very confident that we will meet this guidance. If I am quite bold I would say that the low part of the guidance, the €1.1 billion, is a given for sure.
We know the depreciation expenses will come in around 330-340M EUR, and I am using 45M EUR in full-year interest expenses. This should result in a pre-tax income of 815M EUR and a net income of 591M EUR using an average tax rate of 27.5%. After deducting some of the net income attributable to non-controlling interests, the net income attributable to Verallia will be around 580M EUR or 4.95 EUR per share (and 4.50 EUR per share should the EBITDA come in at the lower end of the guidance). That’s about 65% higher than in FY 2022, mainly due to the anticipated 30-35% EBITDA increase.
Investment thesis
Based on these projections, Verallia is still not expensive. Meanwhile, the demand for glass containers and glass packaging continues to increase, and Verallia’s growth investments are really just allowing the company to catch up with the demand increases. The total net debt level has decreased to 1.3 times the LTM EBITDA which is substantially below the longer-term guidance of 2-3x EBITDA and this means we can expect a generous dividend this year. A 40-50% payout ratio would likely result in a dividend of 2-2.5 EUR per share, while the retained earnings could be used to further expand the asset portfolio.
I do expect the EBITDA to be relatively flat next year as there will be some pressure on pricing considering the cost of raw materials is decreasing and a portion of those savings will be passed on to its customers. That being said, the earnings should remain pretty flat as well, while the net debt should continue to decrease.
Trading at less than 9 times earnings and at an EV/EBITDA ratio of less than 5, Verallia is still attractive thanks to its very robust and resilient performance.
Editor’s Note: This article discusses one or more securities that do not trade on a major U.S. exchange. Please be aware of the risks associated with these stocks.
Read the full article here



Leave a Reply