This article is part of a series that provides an ongoing analysis of the changes made to Akre Capital Management’s 13F portfolio on a quarterly basis. It is based on Akre’s regulatory 13F Form filed on 08/13/2024. Please visit our Tracking Akre Capital Management Portfolio series to get an idea of their investment philosophy and our last update for their moves in Q1 2024.
This quarter, Akre’s 13F portfolio value decreased ~6% from ~$12.09B to ~$11.37B. The number of positions decreased from 20 to 19. The largest five stakes are MasterCard, Moody’s, KKR, American Tower, and O’Reilly Automotive. They account for ~64% of the total portfolio value.
AUM is distributed among private funds, separately managed accounts, and the Akre Focus Mutual Fund (MUTF:AKREX) (AKRIX). Since the 2009 inception through Q1 2024, the mutual fund’s annualized returns are at 14.80% compared to 14.16% for the S&P 500 Index. For H1 2024, the fund returned 6.01% compared to 15.29% for the S&P 500 Index. Their cash allocation is currently at ~1.5% near the bottom end of their historical range. Akre coined the term “compounding machines” to describe the type of businesses he invests in. To learn more about that investing style, check out 100 to 1 in the Stock Market.
Note: positions in the mutual fund not reported through the 13F filings include Constellation Software (OTCPK:CNSWF) and Topicus.com (OTCPK:TOITF). Topicus.com is a spinoff from Constellation Software.
New Stakes:
Airbnb (ABNB): ABNB is a 1.25% of the portfolio position established this quarter at prices between ~$141 and ~$165 and the stock currently trades well below that range at ~$118.
Stake Disposals:
Uber Technologies (UBER): UBER was a small 1.13% of the portfolio stake established during the last quarter at prices between ~$58 and ~$81. The disposal this quarter was at prices between $63.52 and $77.16. The stock currently trades at $73.31.
Brookfield Asset Management (BAM), and Dollar Tree (DLTR): These two remnant stakes were sold out during the quarter.
Stake Increases:
Brookfield Corp (BN): BN is a 6.75% of the portfolio stake established in Q3 2019 at prices between $20 and $24 and increased by ~18% next quarter at prices between $22 and $27. The first three quarters of 2020 saw another ~45% increase at prices between $10 and $33.50. That was followed with another ~30% stake increase during Q4 2022 at prices between ~$31 and ~$35. Since then, there has only been minor adjustments. The stock currently trades at $46.69.
Note: the prices quoted above are adjusted for the Asset Management Business spinoff completed in December 2022. Shares of the spinoff, which assumed the name Brookfield Asset Management, were distributed at a ratio of 1 share of the separated business for every 4 Class A shares held. The parent company was then renamed Brookfield Corp.
CoStar Group (CSGP): The 5.72% CSGP stake was purchased in Q4 2019 at prices between ~$54 and ~$62 and increased by ~75% in the next quarter at prices between ~$52 and ~$74. Q2 2020 saw another ~120% stake increase at prices between ~$53 and ~$73. There was a ~25% reduction in Q2 2022 at prices between ~$54 and ~$68. This quarter saw a ~20% stake increase at prices between $72.73 and $95.69. The stock currently trades at ~$75.
Note: The prices quoted above are adjusted for the 10-for-1 stock split in June 2022.
CCC Intelligent Solutions (CCCS): The very small 0.76% CCCS position was purchased during the last quarter at prices between ~$10.50 and ~$12.50. This quarter saw a ~12% stake increase at prices between $10.55 and $11.98. The stock is now at $10.72.
Goosehead Insurance (GSHD), SOPHiA GENETICS SA (SOPH), and SBA Communications (SBAC): These very small (less than ~1% of the portfolio each) stakes were increased this quarter.
Stake Decreases:
Mastercard (MA): MA is currently the largest 13F stake at ~16% of the portfolio. It was first purchased in 2010 and has consistently increased since. Their overall cost-basis is ~$22 compared to the current price of ~$469 per share. Q1 2020 saw a ~9% stake increase while Q2 2022 saw a ~14% selling at prices between ~$309 and ~$379. That was followed by a ~40% reduction in the last three quarters at prices between ~$365 and ~$489. They are harvesting gains.
Moody’s Corporation (MCO): The initial purchase of MCO happened in Q1 & Q2 2012 in the high-30s price-range. Since then, the position size has doubled at higher prices. Recent activity follows: Q4 2016 saw a ~15% increase at prices between $94 and $109 and that was followed with a ~22% increase the following quarter at prices between $95 and $114. There was a ~18% trimming in the last three quarters. It currently trades at ~$474 and is now the second-largest stake at ~16% of the portfolio.
Note: Akre’s cost-basis on MCO is ~$39.
KKR & Co. (KKR): KKR is a ~13% of the portfolio position established in Q1 2018 at prices between $20 and $24.50 and doubled next quarter at prices between $19.50 and $25.50. There was another ~25% increase in Q4 2018 at prices between $18.50 and $28. The first three quarters of 2020 also saw a ~15% increase. That was followed by a ~10% increase during Q3 2023 between ~$54 and ~$65. The stock currently trades at ~$119. The last two quarters have seen a ~20% trimming.
Note: KKR converted from a partnership to a corporation effective July 1, 2018.
American Tower (AMT): AMT has been in the portfolio for over two decades. It is now at 10.49% of the portfolio. Recent activity follows: the six years through Q3 2018 saw consistent buying almost every quarter. The share count increased over four times from 1.7M shares to 7.1M shares during that period. The buying happened at prices between $65 and $118. The stake was decreased by 9% in the last quarter at prices between ~$185 and ~$217. The stock is now at ~$220. There was marginal trimming this quarter.
Note: Akre is very bullish on AMT as incremental margins are at over 90% and growth in wireless communication is a significant tailwind.
O’Reilly Automotive (ORLY): ORLY is a large 8.88% portfolio stake first purchased in 2005. Over 800K shares were purchased at the time. The position was at 825K shares as of Q1 2017 – every year had seen adjustments but overall, the stake had remained remarkably steady over that twelve-year period – the stock returned ~10x during that time. 2017 saw a ~130% stake increase at an average cost of ~$195. Q1 2021 saw a ~14% selling at prices between ~$425 and ~$509. There was a ~20% selling during Q4 2022 at prices between ~$703 and ~$865. The stock is now at ~$1127. The last five quarters also saw a ~25% trimming.
Roper Technologies (ROP): ROP is a 7.66% of the portfolio position first purchased in Q2 & Q3 2014 at prices between $129 and $150. The stake saw incremental buying in the following quarters. In Q2 2016, there was a ~20% increase at prices between $165 and $185. The first three quarters of 2020 saw a ~22% stake increase at prices between $254 and $453. H1 2021 saw a ~12% trimming and that was followed by a ~5% trimming during Q3 2023. There was minor trimming in the last three quarters. The stock is now at ~$548.
CarMax Inc. (KMX), DigitalBridge (DBRG), Berkshire Hathaway (BRK.B), and Verisk Analytics (VRSK): These small (less than ~1.5% of the portfolio each) stakes were reduced during the quarter.
Kept Steady:
Visa Inc. (V): Visa is a 7.56% of the portfolio stake. It was established in Q2 2012 at a cost-basis of around $30. Q2 2013 saw a one-third increase in the low-40s and that was followed with a 60% increase in Q2 2016 in the high 70s. Q1 2017 also saw another roughly one-third increase at prices between $79.50 and $90. Q4 2023 saw a ~27% selling at prices between ~$229 and ~$262. The stock is now at ~$268. There was a ~7% trimming in the last quarter.
Note: Visa stock split 4-for-1 in March 2015. The prices quoted above are adjusted for that split.
Danaher Corporation (DHR): DHR is a 3.90% of the portfolio position established in Q4 2013 at prices between $47 and $55 and increased by roughly five-times in Q2 2014 at prices between $52 and $59. Since then, the activity has been minor. The stock is now at ~$272.
Note: The prices quoted above are adjusted for the Fortive spinoff in July 2017.
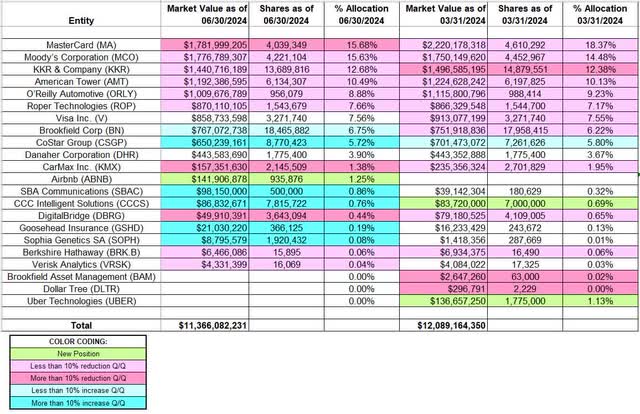
Below is a spreadsheet that highlights the changes to Akre Capital Management’s 13F stock portfolio as of Q2 2024:

Chuck Akre – Akre Capital Management Portfolio – Q2 2024 13F Report Q/Q Comparison (John Vincent (author))
Source: John Vincent. Data constructed from Akre Capital Management’s 13F filings for Q1 2024 and Q2 2024.
Editor’s Note: This article discusses one or more securities that do not trade on a major U.S. exchange. Please be aware of the risks associated with these stocks.
Read the full article here


Leave a Reply