Investment Thesis
Coffee is becoming increasingly integrated into people’s daily routines, regardless of time or place. A successful adaptation strategy to changing consumption patterns should increase the company’s value. However, it seems the market is primarily fixated on the top-line numbers, especially in the emerging growth market of China. While China is indeed crucial and offers long-term growth potential, the company’s true competitive advantage lies in dealing with the routinization of coffee and serving customers through various ways at scale. Therefore, I believe that the market underestimates the true value of the company, offering a good value investment opportunity.
Company Overview
Starbucks Corporation (NASDAQ:SBUX) is the largest roaster and retailer of specialty coffee globally, operating in more than 80 countries with over 37,000 stores. The company’s geographical segments include North America, encompassing the United States and Canada, where it operates approximately 17,000 stores in what is considered a mature market. Additionally, it has an International segment with around 19,000 stores, focusing on growth. In the International segment, China takes the lead with about 6,400 stores, followed by South Korea and Japan, each hosting 1,800 and 1,700 stores, respectively.
Store Count (2023.3Q)
| Regions | Store counts | Weight |
| North America | 17,592 | 47.3% |
| International | 19,630 | 52.7% |
| China | 6,480 | 17.4% |
| Korea | 1,838 | 4.9% |
| Japan | 1,696 | 4.6% |
| Total | 37,222 | 100.0% |
The company’s business segments are categorized based on store operations into two groups: company-operated stores and licensed stores. Starbucks operates approximately 19,000 company-operated stores and has about 18,000 licensed stores. Licensed stores serve as a strategic approach for entering foreign markets with limited local market knowledge, and they represent a capital-efficient business model since the licensees shoulder the investment costs. It’s worth noting that, with the exception of the United States, the Korean market boasts the largest number of licensed stores, where Starbucks is operated by E-Mart, a major retail company often likened to ‘Korea’s Walmart.
When it comes to company-operated stores, they do entail initial store investment costs. Still, they offer the potential for maximizing operating leverage. If these stores can efficiently and profitably recover their investments in a timely manner, they can make a substantial contribution to the company’s earnings and overall value. In markets such as China and Japan, Starbucks directly operates its stores, with significant growth potential, especially in the case of China, where the rapid expansion offers a significant opportunity to leverage the growth effect of company-operated stores.
Store Count (2023.3Q)
| Segments | Store counts | Weight |
| Licensed | 18,190 | 48.9% |
| North America | 7,140 | 19.2% |
| International | 11,050 | 29.7% |
| Co-operated | 19,032 | 51.1% |
| North America | 10,452 | 28.1% |
| International | 8,580 | 23.1% |
| Total | 37,222 | 100.0% |
Successful store expansion has resulted in impressive financial performance for the company over the past decade. Total revenue has more than doubled, increasing from approximately $14,000 million in 2013 to $32,000 million in 2022. Regionally, the North American market has grown by just over 2x, rising from $11,000 million to $23,000 million at a CAGR of 8.7%, while the international market has more than tripled, increasing from $2,077 million to $6,940 million at a CAGR of 14.3%, which has been the driving force behind this remarkable growth.
Operating income has also shown significant growth, increasing from $3,132 million in 2013 to $4,618 million in 2022, representing roughly a 1.5x increase. In North America, operating income increased from $2,365 million to $4,487 million, with a CAGR of 7.4%, just short of doubling its value. Meanwhile, the international segment exhibited a remarkable growth rate, surging from $385 million to $833 million at a CAGR of 8.9%.
Selected Financial Performance
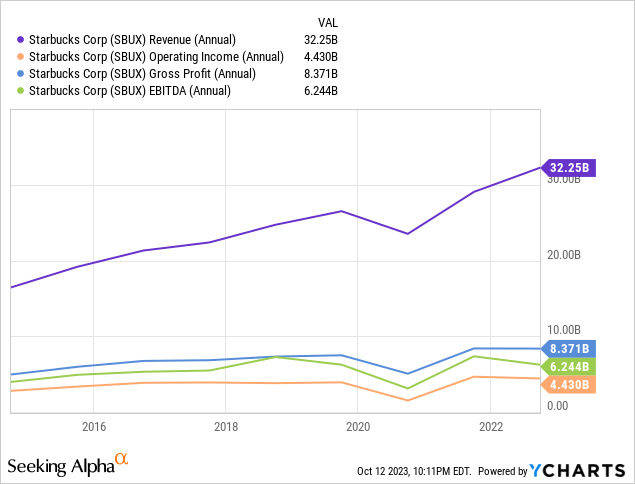
The substantial gap in revenue growth between the mature U.S. market and the growing international markets doesn’t appear to be reflected in the difference in operating income growth rates. The robust growth in operating performance, even in the mature market, indicates the company’s strong and wide economic moats. This, in turn, raises expectations for future value appreciation from international markets with high probability.
Historical Margins
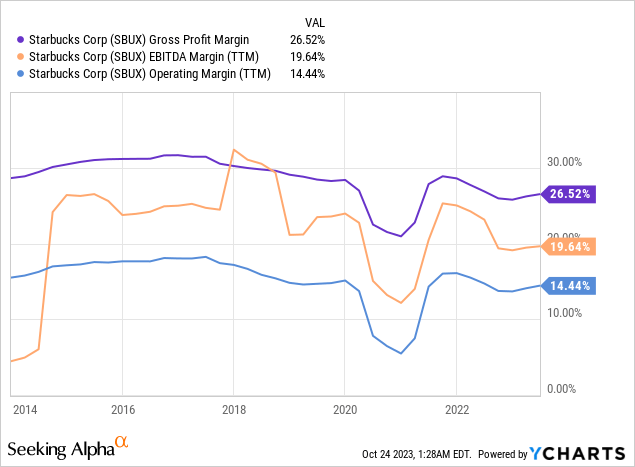
Quality analysis
The company exhibits several characteristics of a high-quality business. Consequently, its historical ROIC (Return on Invested Capital) track record consistently surpasses the industry average, and is even comparable to that of Apple (AAPL), one of the most valuable companies
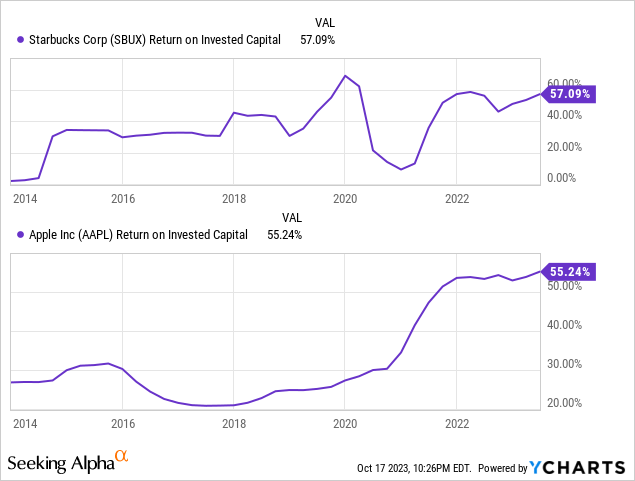
The reason Starbucks consistently achieves above-average ROIC is attributed to the company’s economic moats, which are outlined below
The company provides customers with more satisfying options than its competitors. As a specialty coffee chain, Starbucks not only offers quality coffee but also a variety of choices to cater to different customer preferences, enhancing profitability through diverse pricing strategies. According to a Bloomberg Businessweek article, there are theoretically over 383 billion ways to make a Starbucks latte. While the multitude of recipe possibilities can be seen as fun, one thing is certain: Starbucks offers a much broader range of options compared to its competitors. Financially, this variety generates over a billion dollars in revenue annually. Starbucks is effectively addressing consumer satisfaction, going beyond mere coffee sales. This marketing strategy can be described as “personalization,” where consumers experience positive interactions that make them feel special. According to McKinsey, this concept benefits both consumers and companies, reducing customer acquisition costs by as much as 50 percent, increasing revenues by 5 to 15 percent, and boosting marketing ROI by 10 to 30 percent.
2. However, achieving customer satisfaction comes at a cost. It requires careful consideration and significant investment. The increased complexity in customization has led to higher work intensity for store employees. As a result, labor conflicts have increased, and there is a growing focus on the well-being of store employees, including the formation of labor unions. I believe this is one of the crucial factors that can set the company apart from its competitors. Its store employees are renowned for their high-level customer service skills and quality. Prioritizing investments in them, recruiting, and retaining top-quality store employees can significantly enhance the company’s profitability.
Howard Schultz, the company’s founder, emphasized the importance of improving the work environment for them and the speed of beverage production after a store tour. He stated that serving just five more customers per day in every store worldwide would result in an annual revenue increase of $900 million. A series of initiatives is planned to enhance the work environment, including streamlined store layouts and the introduction of new equipment. Even small details will be improved, such as reducing the size of ice used in making iced beverages to make it quicker and more convenient for employees to add ice.
In contrast, small local coffee shops are facing difficulties retaining staff, particularly in a gig economy that thrived during the pandemic, offering many alternatives for part-timers. Ongoing turnover issues make it challenging for them to maintain a high-quality workforce. While the company may have been influenced to some extent by these trends during the pandemic, its adaptability and capacity for response appear more substantial compared to its direct competitors. This gap is expected to widen further in the future.
3. The company is among the retailers that excel in leveraging technology. They have simplified the process for customers to order and pay using their mobile app. Customers can place orders in advance, even before arriving at the store, and customize their drinks more easily through the app. Additionally, the introduction of various features such as delivery services and benefits through the app effectively enhances the user experience, turning visits into more routine occurrences.
Mobile Order Transactions as % of Total Transactions (U.S. Company‐Operated Retail Stores Only)
Mobile order transaction as % of total transactions (Starbucks)
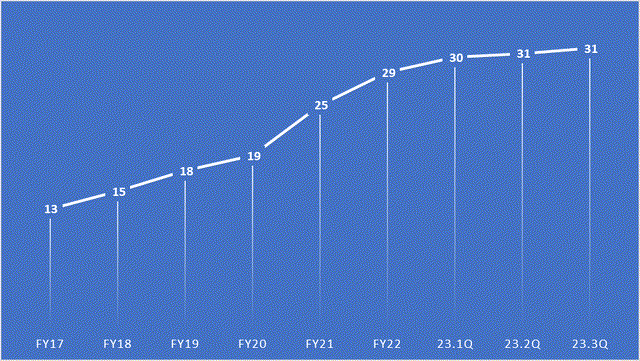
Starbucks’ loyalty program, powered by technology, is highly appreciated by consumers and provides significant financial benefits to the company. As of the end of the third quarter of 2023, there were approximately 31.4 million active members in the United States alone, representing a nearly 30% increase compared to the 24.2 million members two years ago. To provide context, Netflix (NFLX) had approximately 77 million paid subscribers in the United States and Canada, with a growth rate of about 4.5% over two years. The noteworthy aspect here is that even though Starbucks loyalty program members don’t pay a subscription fee, they engage in more frequent transactions and make more payments compared to non-members.
Furthermore, in the United States alone, as of the third quarter of 2023, the total funds loaded onto Starbucks Cards by customers amounted to approximately $2,884 million. Over the past two years, prepaid amounts have accounted for approximately 10-15% of annual sales. Starbucks Cards offer various benefits, including discounts, which encourage more purchases, thereby enhancing cash flows. Additionally, they alleviate working capital burdens and enable efficient capital management within the company.
4. Finally, the company’s store design effectively caters to a diverse range of customer situations and needs. Traditionally, coffee shops primarily focused on the in-store experience. However, evolving consumer needs have necessitated changes in store design to meet those demands. The company has expanded its store formats beyond the traditional café, offering drive-thru, delivery-only, and pickup-only options to accommodate the various ways customers enjoy coffee. According to the company, the breakdown of corporate-operated stores in the United States is approximately 70% drive-thru, 29% café, and 1% pickup. Among these, drive-thru stores are the most economically efficient. The success of these formats likely results from the ability to operate store designs that cater to a diverse array of customer needs. Consequently, store profitability is at an excellent level. In the case of U.S. stores, they achieve a 50% cash-on-cash return, offering exceptional reinvestment opportunities that far exceed the cost of capital.
Valuation
I used an earnings yield approach for valuation and made some assumptions to calculate it. I believe that the company will continue to achieve double-digit growth rates for the foreseeable future. So, I assumed a top-line revenue growth rate of 14% over the next 5 years. The organic growth is estimated at 6%. On the other hand, the growth rate from new units is estimated at 8%. The company’s historical global comparable store sales growth from 2013 to 2022 averaged 5%. Recent trends, such as 5% in Q1, 11% in Q2, and 10% in Q3 of 2023, indicate that the organic growth rates of 6% are a reasonable estimation. The growth rate from new units is expected to be higher than the organic growth rate, taking into account the growth potential of the China market and the high store reinvestment returns.
Global Comparable Store Sales Growth Rates
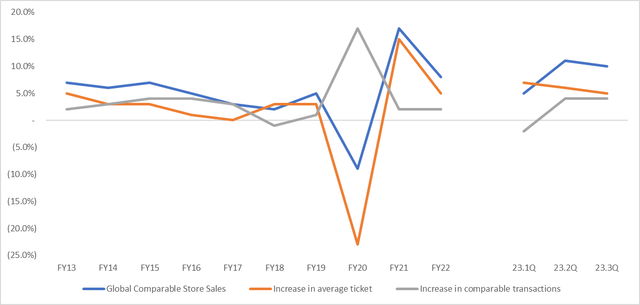
Starbucks
Sources: SEC Filings
Next, the operating profit margin is expected to remain at around 15% in the long term. The company’s business portfolio is well-diversified, with nearly equal proportions of geographical (domestic and international markets) and business segment (company-operated and licensed stores) contributions, which has historically demonstrated a stable margin over the long term.
Furthermore, the operating tax rate is 23.4%, which historically doesn’t deviate significantly from the statutory tax rate. The company’s depreciation and amortization (D&A) expenses account for approximately 5% of its revenues, and this was considered when calculating EBITDA. For the capital expenditure portion to arrive at Free Cash Flows (FCF), a Sales-to-Capital ratio of 3x was applied. Despite seemingly low operating margins, the company can generate substantial cash flows due to its high capital turnover. As seen earlier, its stores boast a cash-on-cash return of up to 50%, and its historical ROIC is also comparable to that of Apple. These assumptions were used to calculate the cash flow, which is as follows.
| LTM | Projected | |||||
| FY23 | FY24 | FY25 | FY26 | FY27 | FY28 | |
| Revenue | 35,016 | 39,918 | 45,507 | 51,878 | 59,141 | 67,421 |
| Growth | 14% | 14% | 14% | 14% | 14% | |
| Organic | 6% | 6% | 6% | 6% | 6% | |
| New Units | 8% | 8% | 8% | 8% | 8% | |
| EBIT | 5,360 | 6,602 | 7,844 | 9,086 | 10,328 | 11,570 |
| Margin | 15% | 15% | 15% | 15% | 15% | 15% |
| Operating Tax rates | 23% | 23% | 23% | 23% | 23% | 23% |
| NOPAT | 4,104 | 5,055 | 6,006 | 6,957 | 7,908 | 8,859 |
| D&A | 1,434 | 1,996 | 2,275 | 2,594 | 2,957 | 3,371 |
| Gross Cash Flows | 6,794 | 7,051 | 8,281 | 9,551 | 10,865 | 12,230 |
| Reinvestment (CAPEX+OPEX) | (4,455) | (1,634) | (1,863) | (2,124) | (2,421) | (2,760) |
| FCF | 2,339 | 5,417 | 6,418 | 7,427 | 8,444 | 9,470 |
| EBTIDA | 6,794 | 8,598 | 10,119 | 11,680 | 13,285 | 14,941 |
| Current Enterprise Value | 126,776 | |||||
| Earnings Yield (EBIT) | 6.1% | 7.3% | 8.4% | 9.6% | 10.7% | |
| Earnings Yield (EBITDA) | 8.0% | 9.4% | 10.8% | 12.3% | 13.9% | |
| Earnings Yield (FCF) | 5.0% | 6.0% | 6.9% | 7.8% | 8.8% | |
Compared to the current 5-year Treasury yield of approximately 4.8%, I find investing in the company’s stock for the long term more appealing. Considering the growth potential of cash flows, stockholders have a higher probability of capital gains, while bonds offer a reduced likelihood of capital gains.
Risks
The company has effectively adapted to external variables, such as economic fluctuations, due to its long-standing competitive advantages. Yet, the heavy reliance on China’s success raises concerns. China’s exposure offers both opportunities and risks. Therefore, I’ve created a downside scenario to address potential challenges like a Chinese market slowdown and evolving business conditions affecting key value drivers.
| Scenarios | Base | Downside |
| Organic Growth | 6.0% | 4.0% |
| New Unit Growth | 8.0% | 2.0% |
| EBIT Margin | 15.0% | 13.0% |
| Capital Turnover | 3.0x | 2.0x |
The downside scenario, when compared to the base-case scenario, generally assumes significantly lower growth rates. This accounts for the uncertainty in the Chinese market, leading to a more pronounced decline in new unit growth rates compared to organic growth rates. Furthermore, since all Starbucks stores in China are company-operated, adjustments have been made to consider the expected impact on operating profit margins and capital turnover rates. The downside scenario results are as follows.
| LTM | Projected | |||||
| FY23 | FY24 | FY25 | FY26 | FY27 | FY28 | |
| Revenue | 35,016 | 37,117 | 39,344 | 41,705 | 44,207 | 46,860 |
| Growth | 6% | 6% | 6% | 6% | 6% | |
| Organic | 4% | 4% | 4% | 4% | 4% | |
| New Units | 2% | 2% | 2% | 2% | 2% | |
| EBIT | 5,360 | 5,895 | 6,430 | 6,965 | 7,500 | 8,035 |
| Margin | 15% | 13% | 13% | 13% | 13% | 13% |
| Operating Tax rates | 23% | 23% | 23% | 23% | 23% | 23% |
| NOPAT | 4,104 | 4,514 | 4,923 | 5,333 | 5,742 | 6,152 |
| D&A | 1,434 | 1,856 | 1,967 | 2,085 | 2,210 | 2,343 |
| Gross Cash Flows | 6,794 | 6,370 | 6,890 | 7,418 | 7,953 | 8,495 |
| Reinvestment (CAPEX+OPEX) | (4,455) | (1,050) | (1,114) | (1,180) | (1,251) | (1,326) |
| FCF | 2,339 | 5,319 | 5,777 | 6,238 | 6,702 | 7,169 |
| EBTIDA | 6,794 | 7,751 | 8,397 | 9,050 | 9,710 | 10,378 |
| Current Enterprise Value | 126,776 | |||||
| Earnings Yield (EBIT) | 5.5% | 6.0% | 6.5% | 7.0% | 7.5% | |
| Earnings Yield (EBITDA) | 7.2% | 7.8% | 8.4% | 9.0% | 9.6% | |
| Earnings Yield (FCF) | 4.9% | 5.4% | 5.8% | 6.2% | 6.7% | |
Even when considering the downside scenario, the earnings yields remain attractive when compared to treasury bond yields. The profitability of domestic markets and other international markets could potentially counterbalance any adverse effects from the Chinese market’s slower growth.
In summary, I believe the company’s current stock price is undervalued when considering its exceptional qualities. The anticipated slower growth in the Chinese market is expected to have a limited impact on the valuation. Therefore, I believe it has the potential for strong long-term market outperformance.
Editor’s Note: This article was submitted as part of Seeking Alpha’s Best Value Idea investment competition, which runs through October 25. With cash prizes, this competition — open to all contributors — is one you don’t want to miss. If you are interested in becoming a contributor and taking part in the competition, click here to find out more and submit your article today!
Read the full article here