After the Fed’s last meeting, the “higher-for-longer” mantra pushed interest rates higher and equity markets lower. At the moment of writing, the ten-year nominal treasury yield has hit 4.75%, the highest point since August 2007.
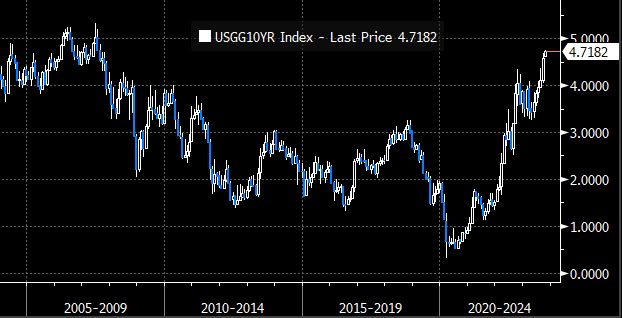
U.S. Generic Government 10-Year Yield (Bloomberg Terminal)
However, even more important than nominal yields are real yields. A real interest rate is the nominal rate minus inflation. Therefore, a real return that an investor realizes after inflation. Since the beginning of 2022, real yields have been skyrocketing, and at the moment of writing, the ten-year real yield has reached 2.39%. For comparison, at the end of 2021, it stood at -1.10%.
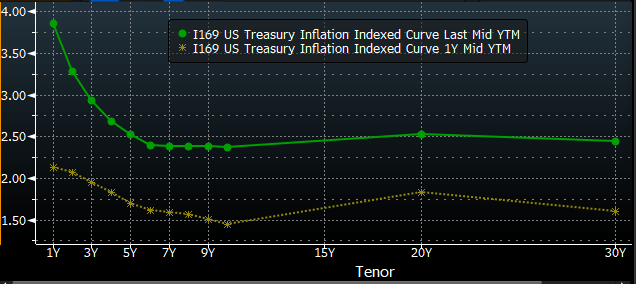
The Current Real Yield Curve Vs. One Year Ago (Bloomberg Terminal)
Just as the U.S. nominal curve, the real curve is also inverted. However, the whole curve is shifting upward, and the long end is marching higher relentlessly. As visible below, the ten-year real yield is at the highest level since March 2009.
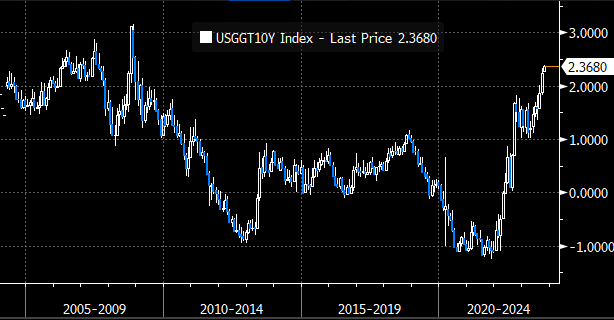
The Ten-Year Real Yield (Bloomberg Terminal)
Rates And Equity Multiples
The main question is, how do rising real rates impact equity multiples?
Real interest rates and equity multiples are negatively correlated, which implies that rising rates push equity multiples lower. The easiest way to show this is by using the regression analysis between a real rate and the price-to-earnings (P/E) multiple.
I ran a regression analysis using the 2-year real rate and the P/E multiple of the S&P 500 Index. The test is based on the annual data for the last eighteen years (no info for the 2-year TIPS before that) and shows a clear inverse relationship between the two.
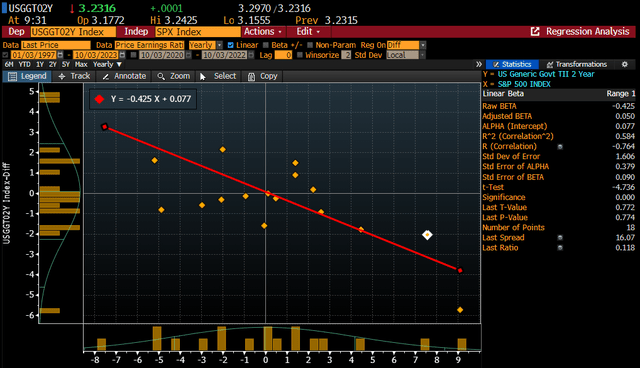
Regression Analysis Between 2 Year Real Yield And The S&P 500’s P/E Ratio (Bloomberg Terminal)
Based on the data from the last eighteen years, the formula to calculate the change in the dependent variable (the P/E multiple) using the moves in the independent variable (2-year real yield) is the following:
Change in the P/E ratio = (0.077 – change in yield) / 0.425
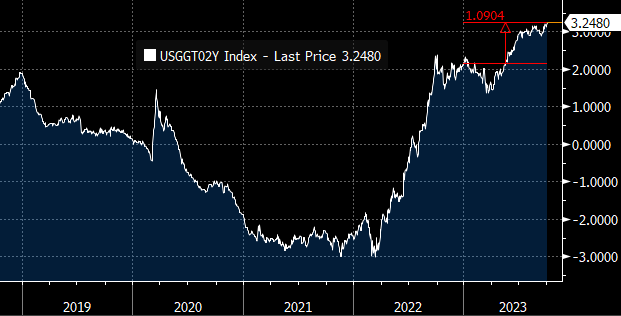
The Two-Year Real Yield (Bloomberg Terminal)
Since the beginning of the year, the 2-year real yield increased by 1.09%. Thus, based on the historical data, the SPDR® S&P 500 ETF Trust’s (NYSEARCA:SPY) P/E multiple should have decreased by roughly 2.4. However, so far, the multiple has gone in the opposite direction.
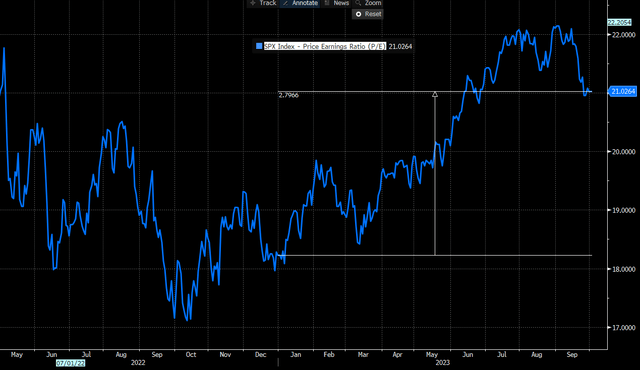
S&P 500’s P/E Multiple (Bloomberg Terminal)
As seen in the chart above, during 2023, the S&P 500 experienced a multiple expansion from 18.23 on the last day of 2022 to 21.02 at the moment of writing. In other words, contrary to its historical inverse correlation to real yields, the P/E multiple increased by 2.79.
Also, besides firmly moving against the historical trend, the current P/E is above the average for the last 20 years, which stands at 18.37.
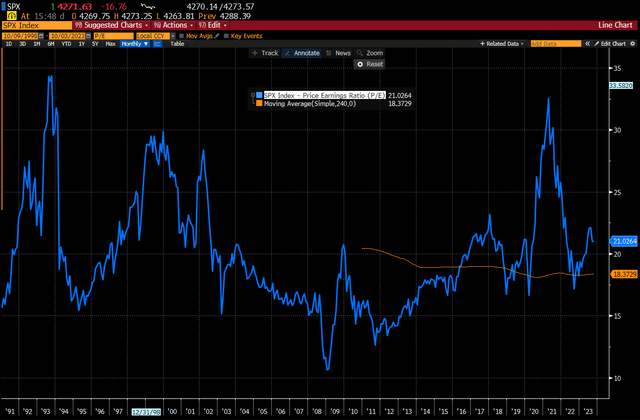
S&P 500’s P/E Ratio And Its 20-Year Average (Bloomberg Terminal)
Earnings Projections
Although the P/E ratio rose this year and currently stands above the historical average, this would not be a bad sign if the equity markets were supported by improving profit expectations. However, Q3 2023 projections stand at -0.1% and if confirmed, will mark a fourth consecutive quarter of declining earnings.
Additionally, the question is, how realistic are expectations for next year? Presently, the forecast for Q4 2023 stands at +8.3%, and for the fiscal year 2024 at +12.2%. The main culprits for the earnings recession during the last four quarters were high inflation and rising borrowing costs. But will these headwinds abate, and can we expect a double-digit profitability growth?
After the latest moves in the real rates, those forecasts don’t look rational to me. With a steepening interest curve, companies and consumers will see their borrowing costs surge. For example, the average interest rate on 30-year mortgage products now stands at 7.80% and has increased by 0.65% since July. How long can this last before inflicting significant harm on the construction industry?
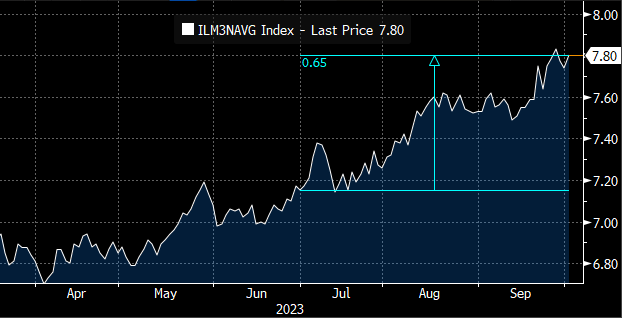
The Average Rate On Fixed 30-Year Mortgage (Bloomberg Terminal)
Additionally, the share of new cars bought on credit is approximately 80%, while the average loan span is between 5 and 6 years. Also, during the last 30 days, the rate on the 5-year U.S. bond increased by an additional 0.47%. As this industry has ongoing issues with strikes, the slowdown on the demand side could inflict additional negative contribution to the overall economy.
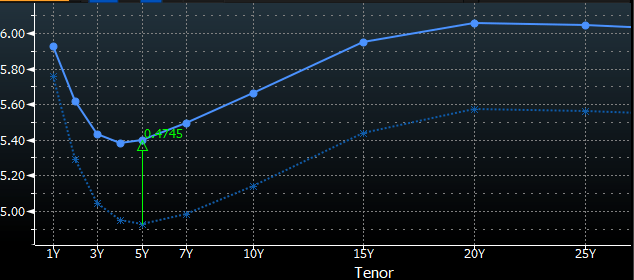
U.S. Nominal Yield Curve (Bloomberg Terminal)
Readers interested in learning more about the surging long-end yields and the next-year projections should read my previous article that focused on the iShares 20+ Year Treasury Bond ETF (TLT).
Technical Picture
Aside from the bleak fundamental picture, the technical background shows that SPY breached its double resistance around $432 and could proceed to the next one at $410.
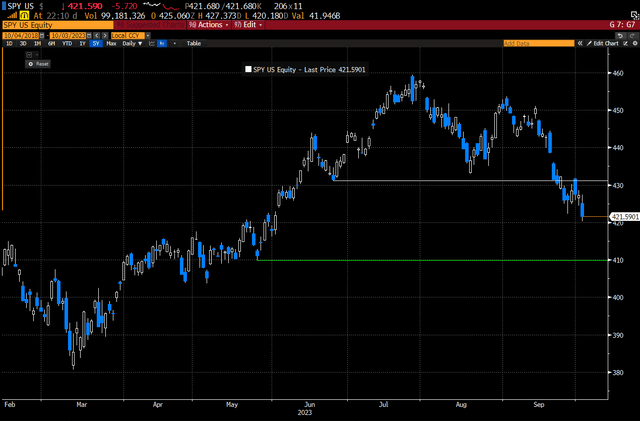
SPY Chart (Bloomberg Terminal)
Concluding Thoughts
Although there are relevant reasons why SPY could proceed with its downward trend, I’m not advocating shorting it. When it comes to equities, I’m a long-only investor. However, considering all the headwinds, from rising multiples and high earnings projections to spiraling borrowing costs, I believe it’s prudent to stay out and invest elsewhere where the reward-to-risk ratio is higher.
Until my next article, be patient with your investments and give them time to grow!
Read the full article here






Leave a Reply