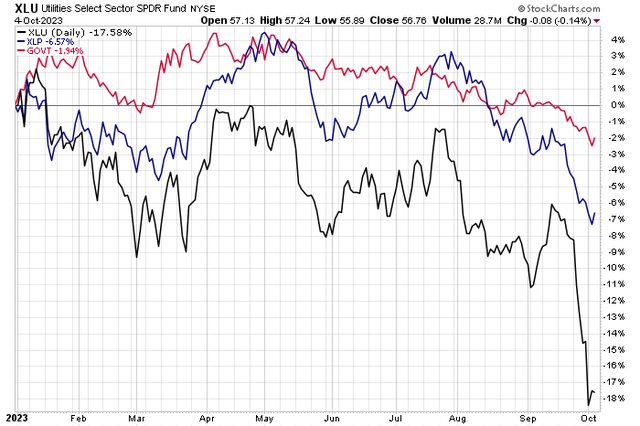
The recent bout of selling pressure across the equity market has no doubt been brought about by the steep rise in yields across the Treasury curve.
Since mid-July, the 10-year rate is up a full percentage point while the long bond yield is up a bit more than that. Higher borrowing costs for corporate America is a major challenge for profitability among indebted companies. Two sectors that rely on borrowing funds for operations include the defensive Consumer Staples and Utilities areas.
These niches feature stable companies that have the ability to lever up since wild cyclical swings across the macroeconomy do not impact them as much as other sectors. With higher rates, though, these same firms will have to deal with higher interest expenses.
I reiterate my sell rating on the Invesco S&P 500 Low Volatility ETF (NYSEARCA:SPLV). Even after a 10% drop from its late-July highs, I still see the fund as overvalued. Moreover, weak momentum is now a near-term risk as we head into the end of 2023.
Utilities, Staples Suffer Amid Rising Lending Costs

StockCharts.com
According to the issuer, SPLV invests in an index tracking 100 securities from the S&P 500 with the lowest realized volatility over the past 12 months. Volatility is a statistical measurement of the magnitude of up and down asset price fluctuations over time. The ETF is rebalanced and reconstituted quarterly in February, May, August, and November.
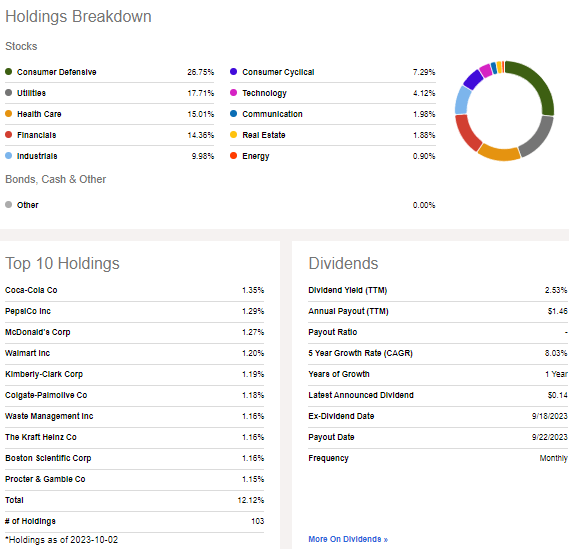
As it was in my initial analysis earlier this year, SPLV’s expense ratio is low at just 0.25%. The fund has total assets under management of $8.0 billion as of October 3, 2023, and its current trailing 12-month dividend yield is about 1.5 times that of the broader market at 2.53%. Liquidity is very strong with SPLV as its 90-day average volume is nearly two million shares while its 30-day median bid/ask spread is narrow at just two basis points. Momentum is extremely weak right now given the steep pullback in recent weeks, which also holds true relative to the S&P 500.
SPLV has high exposure to the large-cap value area on the Style Box. Invesco lists total large-cap value exposure at 13.3% while just 8.2% of the fund is large-cap growth. There’s also a material mid-cap allocation – more than 40% of the portfolio is in that market-cap size.
With more than 26% exposure to the Staples sector and a very notable overweight to Utilities (17.7%), the low-volatility fund could look substantially different at the next reconstitution date given the unusual moves we have seen among S&P 500 constituents in Q3 and to begin Q4.
Mega-cap tech stocks have outperformed lately given their high cash positions and strong free cash flow. SPLV’s latest forward P/E ratio is better compared to earlier this year. At 17.7 times earnings, it is still not cheap. Considering the risk that higher borrowing costs bring, I assert that it is still too expensive of a valuation.
SPLV: Fund Profile & Dividend Information

Seeking Alpha
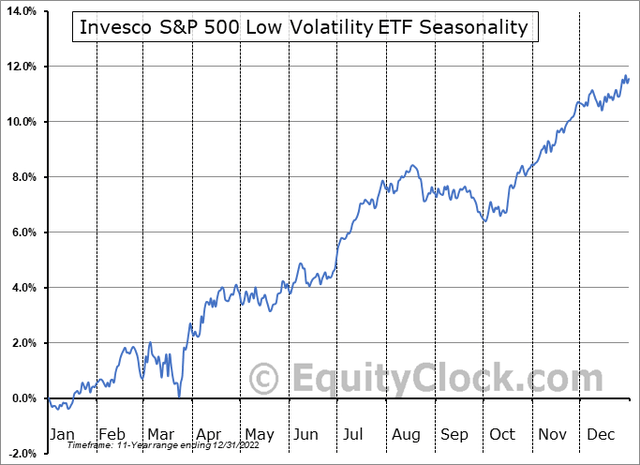
Seasonally, SPLV tends to follow closely to the S&P 500’s trend of rallying in Q4 after an August to September pullback, according to data from Equity Clock. So far in 2022, the fund has followed seasonality well, so this is a bullish factor for investors to consider into year-end.
SPLV: Bullish Seasonal Trends Oct-Dec

Equity Clock
The Technical Take
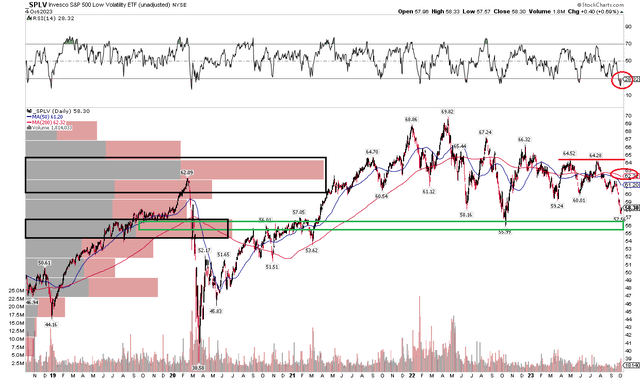
Back in March, I noted significant resistance in the $63 to $66 range that would likely give the bulls fits. That played out. Notice in the chart below that shares never made through the $65 price point on a pair of rally attempts in Q2 and Q3. In recent weeks, SPLV has plunged to under $58, and with a falling long-term 200-day moving average indicator line, the bears are further asserting themselves. What’s more, the RSI momentum index at the top of the graph shows that the ETF is the most oversold it has been since the COVID crash. Is a bounce possible? For sure, but the $59 to $60 area may be where the rally could stall based on that zone being where SPLV found support in the first half (former support becomes new resistance).
Also, take a look at the volume by price indicator on the left side of the chart. The low to mid-$60s is where a large amount of shares exchanged hands – making it a key area of possible resistance on the way back up. On the flip side, the $55 to $56 area could be near-term support. Overall, though, I would avoid SPLV as it continues to trend lower.
SPLV: Trending Lower, Eyeing Possible Mid-$50s Support

StockCharts.com
The Bottom Line
I reiterate my sell rating on SPLV. While its expense ratio is reasonable and it is a highly liquid product, the valuation is not cheap given the more concerning fundamentals among this ETF’s major sector holdings. Finally, the technical situation is not encouraging.
Read the full article here


Leave a Reply