Last weekend’s article was titled “Make or Break,” and based on this week’s performance, the S&P 500 (SPY) is taking the latter option. An October reversal was developing but bulls failed to step in at higher lows and cowered in fear as the weekend approached. Friday’s close was ominous.
One small positive is that the key inflection level of 4216 has held (the low of the week was 4323), but this was more to do with the clock stopping on the decline rather than any signs of support. Monday’s re-start will be crucial and there is a high risk of a collapse.
This week’s article will focus on what could happen if 4216 breaks and if there is still any chance of a Q4 rally. Various technical analysis techniques will be applied to multiple timeframes in a top-down process which also considers the major market drivers. The aim is to provide an actionable guide with directional bias, important levels, and expectations for future price action.
S&P 500 Monthly
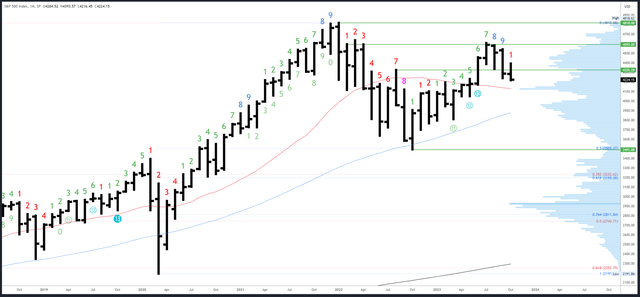
Ideally, reversals form when the low of the bar is set in the first part of the time period and the rally continues into the end. The October bar bottomed on the 3rd of the month and was looking promising, but is now below the open and back near the lows. With seven sessions left in October, this is a red flag.
At current prices below the September low of 4238, the monthly chart is hovering in no man’s land. 4130-40 is the first major area of support.

SPX Monthly (Tradingview)
Monthly resistance is now the October high of 4393, then 4593-4607.
4195 is minor support, with 4130-40 an important level at the 20-month MA and the high volume node (also the centre of the 3491-4818 range).
The September bar completed a Demark upside exhaustion count. This is having a clear effect and the weakness can persist over several bars (months). It will take at least 9 months for another count to complete.
S&P 500 Weekly
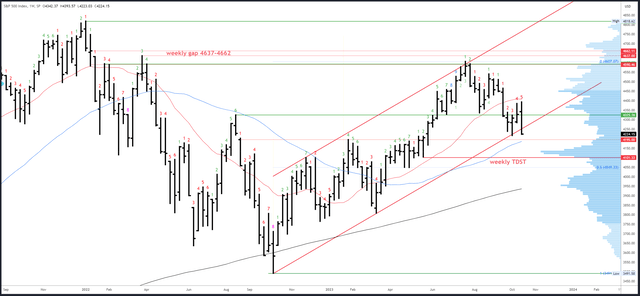
This week’s bar ‘engulfed’ the range of the previous bar and closed at the lows. It’s about as bearish as it gets. Furthermore, the weekly channel has now been broken after a feeble two week bounce. New lows look likely.
While there are support areas below, the price action does not suggest they are worth speculating on until a positive reaction. i.e. a return back above 4216.

SPX Weekly (Tradingview)
Initial resistance is at 4325-35, then 4393. The broken channel may also be a hinderance and will be around 4260 next week.
The first potential support is 4195. The 50-week MA will rise to the around 4194 next week so there is decent confluence in the area.
A downside (Demark) exhaustion count will be on bar 6 (of a possible 9) next week.
S&P 500 Daily
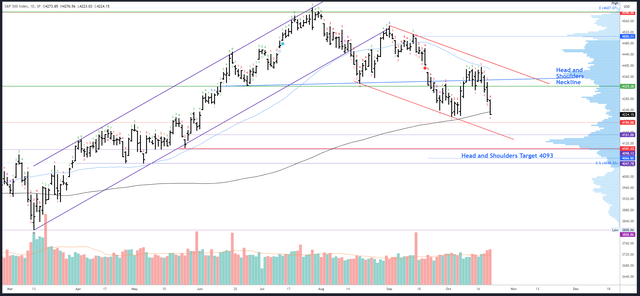
The daily chart has some stiff resistance in the 4400 area. While I expected a dip from this area, the strength of the move down and the break of 4283 were a surprise. The heavy volume on Thursday and Friday underlined the bearish shift.
Friday’s 4224 close was below the 200dma and perilously close to the 4216 inflection point. A further gap down on Monday below 4216 could trigger some real panic and the proximity to the anniversary of Black Monday 1987 (Monday 19th October) won’t help sentiment. I’m not saying there will be a repeat of the 22.6% daily drop, but a 3-5% drop is possible.
It is worth noting both the previous two weekends have been equally worrying for investors and yet both the following Mondays have been strong and closed higher. However, this time the situation is more dangerous – for one, it is tempting fate to look for a third Monday recovery in a row. Secondly, previous weeks did not have such a bearish technical set-up.

SPX Daily (Tradingview)
Resistance is the same as last week, starting at the 4393 high up to gap fill at 4400. The 50dma and red channel will decline into the same area and add to the resistance there.
Support is the obvious 4216, then 4195 and 4151.
A downside (Demark) exhaustion count is underway and will be on bar 7 (of a possible 9) on Monday. A reaction is expected on bars 8 or 9 so this could lead to a bounce on Tuesday or Wednesday, although a solid bottom may need higher timeframe exhaustion and the weekly count is still several weeks away from completion.
Drivers / Events Next Week
Wars between Ukraine/Russia and Israel/Hamas are a constant source of worry and negative headlines. Markets have a mixed performance with this backdrop so there is not necessarily a need to sell everything. Even so, it’s not a time to make reckless investing decisions (like buying during Friday’s session).
The blow off in yields and the ‘higher for longer’ theme is another major concern for stocks. I still think long-term yields will top in Q4 but this stage of the rally has been stronger than I anticipated and I am now looking at mid-November as a time for a reversal. This is when higher timeframe exhaustion signals will kick in.
As an aside, one way for yields to top is for equities to crash, 1987 being a good example. Another way is for unemployment claims to spike. Readings near 250k could signal a change.
US politics and the failure to agree on a House Speaker is another worry for markets. Perhaps things can proceed more smoothly now Jim Jordan is out of the race, but this is yet more political malaise following the debt ceiling debacle and the Fitch downgrade of the US Credit Rating. To top it off, President Biden is asking for a huge funding package for Ukraine, Israel and other campaigns just when Fed Chair Powell is warning of an unsustainable fiscal path.
Earnings season is in full swing. 86 companies from the S&P500 have reported. 80% have beaten EPS estimates on +2.93% growth, while 63% exceeded revenue estimates on +6.40% growth. 165 companies from the S&P500 will report next week, including Tech heavyweights Amazon (AMZN), Meta (META), Microsoft (MSFT) and Alphabet (GOOGL).
Data next week is unlikely to change the narrative much. PMIs are released on Tuesday, with advance GDP and unemployment claims due on Thursday. Core PCE Price Index data is out on Friday.
Probable Moves Next Week(s)
The S&P500 is a dangerous position. Friday’s sell off was on heavier-than-average volume and the session closed right at the lows, below the 200dma and very close to 4216 support. The odds for a collapse are much higher than usual.
It’s a similar situation to four weeks ago when I warned the S&P500 was ‘Set Up for a Crash.’ Back then, I was prepared to bet against a crash happening and I have been trying to get long in October for what is usually a strong period during pre-election years. However, October is a double-edged sword – it can often reverse September weakness and end strong, but more crashes (<5% weekly drops) happen during September and October than in any other months.
Given the risks, I cannot advocate longs again unless the technical picture changes back bullish. There are various ways this could happen, but all require a weekly close above 4216 next week and this would only be the first stage.
Breaking below 4216 looks probable and would mean the 4607 high is highly unlikely to be exceeded until a much larger decline unfolds. 4049 and the 50% retrace are a minimum target, although there are several ways to get there. One involves a direct collapse with only small bounces. The other involves a reversal and a Q4 rally after all, but only to lower highs and leading to a later drop. Recovering from 4140ish and closing back above 4216 could set this up.
I am painfully aware I may be shaken from my long bias just when the latter scenario is about to unfold, but as I said the risk is too high to do anything speculative at this point and the odds are not in the bulls favour. Stay safe.
Read the full article here


Leave a Reply