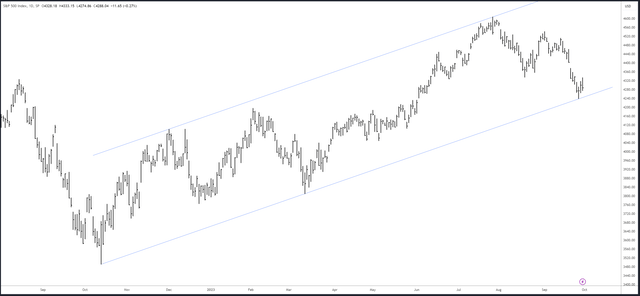
The S&P 500 (SPY) was set up for a possible crash this week, but as explained in my last article, an initial collapse was expected to reverse again. A failed bearish pattern is often a good buying opportunity. Late on Wednesday, price bounced strongly off the channel shown below and the recovery to 4333 was ever so close to reclaiming the all-important 4340 level to trap the bears.
SPX Daily Channel (Tradingview)
Unfortunately, I missed the initial turnaround as last week’s article drew the same channel on the weekly chart which placed it “at 4200ish in confluence with the 4195 break-out area.” Now, after Friday’s drop, I’m left asking the same question as many others: is the bottom in?
To help answer this, various tried and tested technical analysis techniques will be applied to the S&P 500 in multiple timeframes. The aim is to provide an actionable guide with directional bias, important levels, and expectations for price action. The evidence will then be compiled and used to make a call for the week(s) ahead.
S&P 500 Monthly / Quarterly
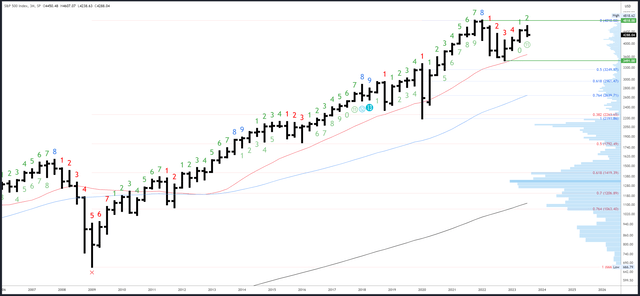
The Q3 bar closed on Friday. A higher high and higher low were made in Q3, but there was clear rejection over the highs of Q2. This could be the start of a reversal pattern lower, but at least another bar is needed to form a reliable bias.
SPX Quarterly (Tradingview)
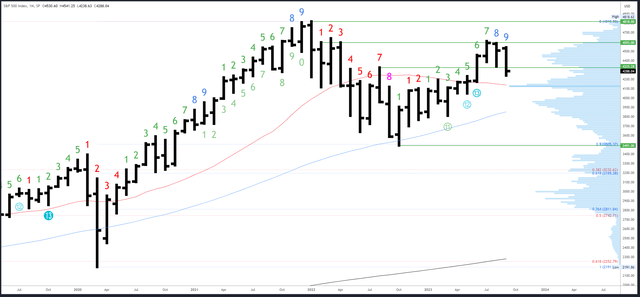
The monthly bar failed to hold 4335 support and made a second lower high and lower low. Furthermore, it closed near the lows at 4288 which gives it a bearish tilt. October could fix all that but it likely makes a lower low first. Check September/October 2021, or even September/October 2022 for a possible guide.
SPX Monthly (Tradingview)
Monthly resistance is the broken support of 4335, then 4593-4607.
4195 is the first support, with 4140-50 an important level at the 20-month MA and the high volume node (also the centre of the 3491-4818 range).
The September bar is number 9 (of a possible 9) in a Demark upside exhaustion count and will complete the signal. This is having a clear effect and can persist over several bars (months).
S&P 500 Weekly
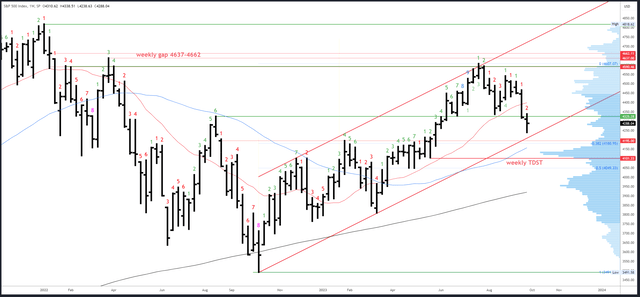
This week’s bar needed to close flat or higher to create a potential reversal pattern. It came close, but Friday’s sell-off created a lower close and the chart remains near-term bearish.
I have left my weekly channel unchanged, but the reaction from the same channel drawn on the daily chart (shown in the introduction) leaves me wondering if I should tweak it. There’s no definitive rule on this and it may still be tested if lower lows are made.
SPX Weekly (Tradingview)
4325-35 is the first resistance, then 4430.
Potential support is at the channel now at 4215, with the 4195-200 break-out area just below. The 50-week MA will be at 4170 next week.
A downside (Demark) exhaustion count will be on bar 3 (of a possible 9) next week. New counts are getting interrupted by the choppy conditions and a persistent trend is needed to progress towards the next exhaustion signal.
S&P 500 Daily
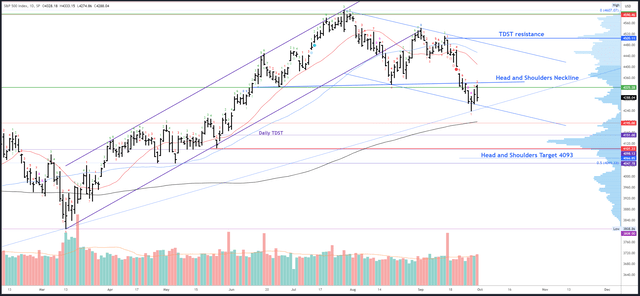
Wednesday’s reversal came on the completion of the Demark exhaustion count (bar 9) and from a decent confluence of support as the channel also lined up with the gap from 2nd June. However, without a strong close over 4340, it’s not enough to make a high conviction call on a bottom, especially as the higher timeframe charts don’t show reversals. The volume patterns aren’t convincing either – compare volume at this week’s lows to the lows in March.
The dominant pattern on the daily chart remains the head and shoulders pattern and both Monday’s high and Friday’s high were pushed back from just under the neckline, now at 4342.
SPX Daily (Tradingview)
4335-45 is the first resistance, then 4375 at the gap. Trading above 4430 resistance should confirm the low is in.
Potential supports are the obvious 4238. then the 200dma at 4200 and finally TDST at 4151.
A downside (Demark) exhaustion count completed on Wednesday and produced the expected reaction. A new upside count is underway and will be on bar 3 on Monday. This means no reaction is expected next week.
Events Next Week
A last-minute funding bill was agreed on Saturday to extend government funding for 45 days. This is clearly a positive, but only a short-term one.
Next week’s data will deliver some important readings on the labour market and PMIs. Now that the market is positioned ‘higher for longer’, will the data support this view or contradict it?
Tightness in the labour market has clearly eased and the last NFP headline figure of 187k was accompanied by a 3.8% unemployment rate, up from an April low of 3.4%. Furthermore, readings in June and July have been revised 110,000 lower. This is a positive for the fight against inflation, but slightly worrying for the economy given the other headwinds.
Data on JOLTS Job Openings will be released on Tuesday. The last release showed a drop to 5.773m, the lowest since January 2021.
NFP is due on Friday. A weak report coupled with poor PMI readings could challenge the market’s ‘higher for longer’ stance. Have rates moved too far?
On the contrary, hot readings could create more panic and still higher rates. I do think we are in the last phase of the yield rally, but strong trends often finish with a blow-off move which can extend further than expected.
Probable Moves Next Week(s)
The call for next week would have been much easier if Friday made a bullish close above 4340. This would have opened up a higher start to the week and allowed me to answer this week’s title – Is the Bottom In? – with a reasonably confident ‘yes.’
As things stand, the S&P500 is in no-man’s land. A quick resolution for either side looks unlikely and uncertainty could continue for much of the week as Friday’s NFP looms large.
Saturday’s agreement on the government funding bill should cause a pop higher on Monday, but even if it breaks above Friday’s 4333 high, there is resistance at 4342 and the gap at 4375. Strength would need to be maintained into the end of the week for this to evolve into a bullish signal and I suspect it is a ‘sell the news’ event that fades lower again.
While the bottom could be in at 4238, the weak September close and the usual pattern of a lower low in October means a drop to 4200 at the 200dma and the break-out area is more probable. 4150 is also possible on a last capitulation.
I will continue to look for ways to buy and position long into the seasonally strong Q4. My focus is on either buying new lows in the 4150-200 area, or above 4345 into a strong weekly close. The former is a riskier approach and requires additional analysis. For example, if Thursday is closing weak near 4200, I would not buy into Friday’s NFP. There’s always another day and another set-up.
Read the full article here


Leave a Reply