Introduction
The Phoenix-based Southern Copper Corporation (NYSE:SCCO) is a majority-owned, indirect subsidiary of Grupo México, S.A.B. de C.V. (OTCPK: GMBXF).
As of June 31, 2023, Grupo Mexico, through its wholly-owned subsidiary Americas Mining Corp (“AMC”), owns 88.91% of its capital stock.
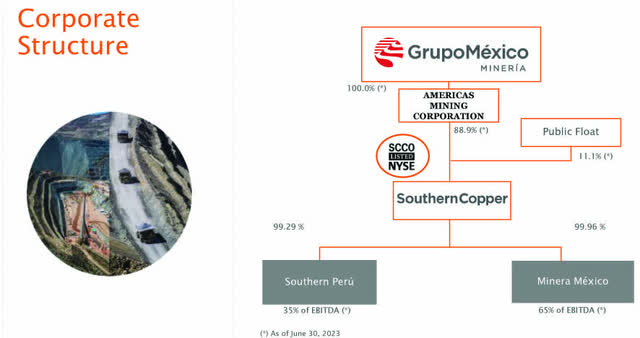
SCCO Diagram Business (SCCO Presentation June 2023)
The company is an integrated producer of copper, representing about 84% of the revenue in Q2’23, and other metals (mainly molybdenum, silver, and zinc).
Note: This article updates my May 29, 2023 article. I have followed SCCO on Seeking Alpha since January 2021.
The company operates mining operations, smelting, and refining facilities in Peru and Mexico (See picture below). SCCO copper reserves are 44.8 MMT as of March 2023. Production cash cost was $0.78 per pound in 2022, leaving a comfortable profit margin.
From the most recent company June presentation, Southern Copper also conducts exploration activities in Argentina, Chile, and Ecuador.
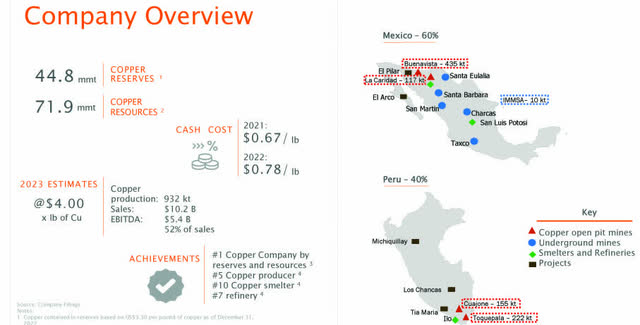
SCCO Company Overview (SCCO Presentation)
1 – Summary
On July 27, 2023, SCCO reported second-quarter 2023 earnings of $0.71 per share on a net sale of $2,300.7 million, beating analysts’ expectations. Revenues were about the same as the prior-year quarter.
Cash flow from operating activities in Q2’23 was $797.1 million, representing an increase over the $309.9 million posted in Q2’22.
Southern Copper Corporation owns the world’s largest copper reserves at 44.8 MMT. SCCO’s total production is expected to be 1.6 M tons by 2032, with a cash cost of $0.78 per pound in 2022.2 – Stock performance
Southern Copper is one of the two copper companies I cover at Seeking Alpha, after Freeport-McMoRan Inc. (FCX). However, Freeport McMoRan produces a significant amount of gold from its mine in PNG and should not be considered a pure copper play.
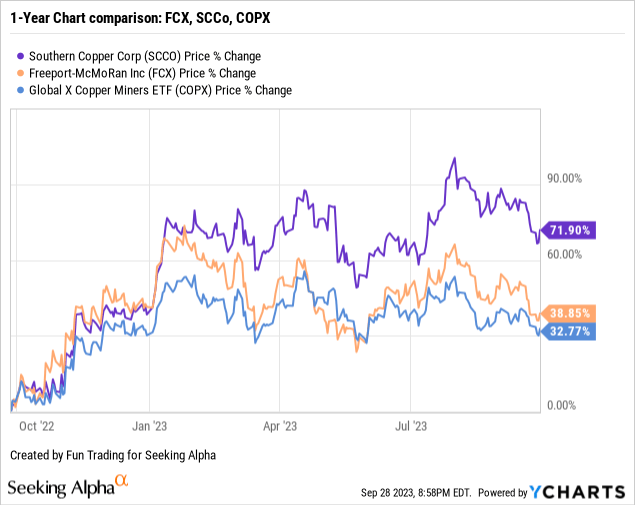
SCCO is up a whopping 72% YoY, outperforming FCX and COPX.
2 – Investment Thesis
Southern Copper and Freeport-McMoRan are two solid copper companies in terms of balance sheets that pay generous dividends. SCCO has a yield of 4.77%, while FCX pays 1.52%.
The main difference between FCX and SCCO is that the latter is not producing significant gold and, thus, is more directly correlated to copper price fluctuation.
The copper price is down approximately 12% YoY.
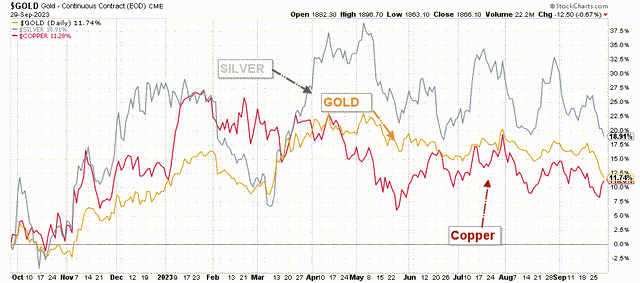
SCCO 1-Year Chart Gold, Silver, Copper (Fun Trading StockCharts)
The outlook for copper is still uncertain and will likely be volatile in H2 2023 due to a lack of solid demand growth in China and rising recession risks. Copper futures fell below $3.70 per pound in September, the lowest since late May (see chart below), “amid persistent pressure from a strong dollar and weak industrial sentiment worldwide.”
Global copper prices are expected to fall to $7,000 per tonne this year.
Contracting manufacturing activity and slumping industrial profits in China have turned investors bearish. The country consumes about half of the world’s copper and the metal, used in construction and power is often viewed as an economic bellwether.
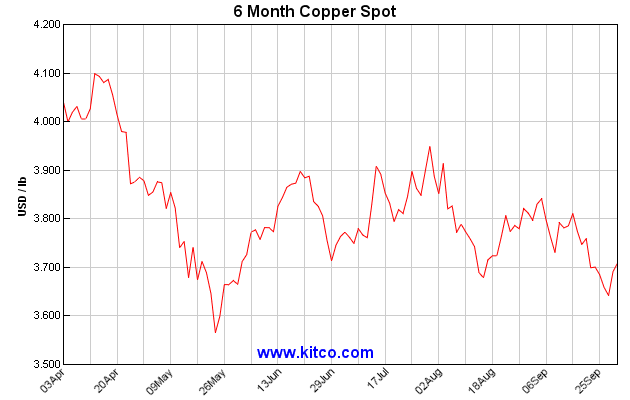
SCCO 6-month Chart (Kitco)
However, according to analysts at UBS, copper prices could hit $4 per pound in 2024.
Our China copper predictor (about 80% historically accurate) suggests that demand will grow around mid-single digits year-over-year through mid-year from a low (Covid-lockdown) base,
Thus, long-term investors should continue accumulating this highly cyclical stock on any significant weakness. But, due to extreme volatility in the copper demand, I recommend short-term trading LIFO. About 50% should be allocated to this task to minimize the risks of a sudden severe retracement that can happen without warning.
Southern Copper – Q2’23 – Balance Sheet and Trend History – The Raw Numbers
| Southern Copper | Q2’22 | Q3’22 | Q4’22 | Q1’23 | Q2’23 |
| Total Revenues in $ Million | 2,306.9 | 2,156.9 | 2,820.3 | 2,793.9 | 2300.7 |
| Net income in $ Million | 432.3 | 519.0 | 902.4 | 813.2 | 547.5 |
| EBITDA $ Million | 1,025.7 | 1,025.7 | 1,649.8 | 1,589.2 | 1138.7 |
| EPS diluted in $/share | 0.56 | 0.67 | 1.17 | 1.05 | 0.71 |
| Cash from Operations in $ Million | 309.9 | 590.1 | 1,081.9 | 1,185.2 | 797.1 |
| Capital Expenditure in $ Million | 224.6 | 227.9 | 290.9 | 238.1 | 252.5 |
| Free Cash Flow in $ Million | 85.3 | 362.2 | 791.0 | 947.1 | 544.6 |
| Total cash $ Million | 2,355.7 | 2,184.8 | 2,278.1 | 2,440.4 | 2,199.3 |
| Total Long-term Debt in $ Million | 6.549.4 | 6,550.3 | 6,251.2 | 6,252.0 | 6,252.9 |
| Dividend $/sh | 0.75 | 0.50 | 1.00 | 1.00 | 1.00 |
| Shares outstanding (diluted) in Million | 773.1 | 773.1 | 773.1 | 773.1 | 773.1 |
Source: Southern Copper release.
Analysis: Revenues, Free Cash Flow, and Copper/Silver/Molybdenum Production
1 – Revenues were $2,300.7 million for the second quarter of 2023
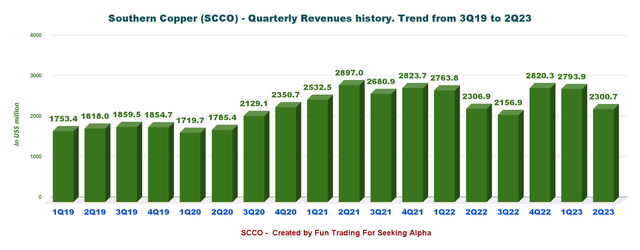
SCCO Quarterly Revenue History (Fun Trading)
Southern Copper’s earnings per diluted share were $0.71 per share, and revenues were $2.301 billion. The Q2’23 adjusted EBITDA was $1,115.5 million, an increase of 9.2% from the $1,021.4 million recorded in Q2’22. The adjusted EBITDA margin was 48.5% versus 44.3% in Q2’22.
Net sales were slightly higher than in 2022 due to an increase in the sales volume for copper (+11%), silver (+3.3%) and zinc (+9.2%) and to better prices for molybdenum (+41.9%). These variances were partially offset by lower average metal prices for copper (-10.8%, LME) and zinc (-25.9%) and by a decrease in the sales volume for molybdenum (-4.2%).
Q2’23 net income was $547.5 million, representing a 26.7% increase compared to the $432.3 million in Q2’22. On July 20, 2023, the Board of Directors authorized a dividend of $1.00 per share.
SCCO is considered a low-cost operation with a cash cost per pound of $1.12 net of by-products in Q2’23 or $0.94 per pound for FY23.
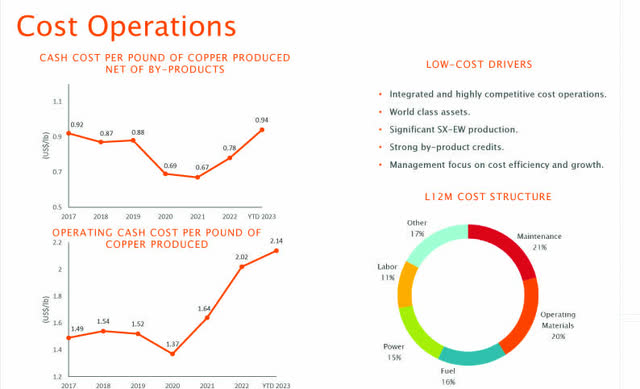
SCCO Cost Operations (SCCO Presentation)
2 – Free cash flow was $544.6 million in the second quarter of 2023
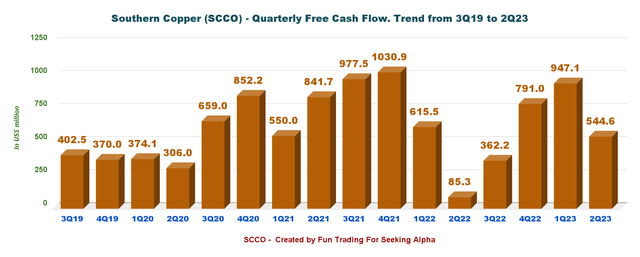
SCCO Quarterly Free Cash Flow History (Fun Trading)
Note: I calculate the generic free cash flow using the cash from operating activities minus CapEx.
Trailing 12-month free cash flow was $2,644.9 million, with $544.6 million in Q2’23. The free cash flow generation has been very healthy in the past three quarters.
3 – Net debt was $4.05 billion on June 30, 2023.
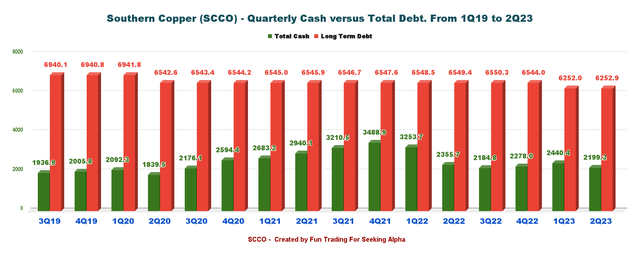
SCCO Quarterly Cash versus Debt History (Fun Trading)
On June 30, 2023, SCCO had $2.199 billion in consolidated cash and long-term debt of $6.25 billion.
4 – Production analysis – Copper-Cu, Silver-Ag, and Molybdenum-Mo.
Note: The weight in metric tons is equal to 2,204.6 pounds
| Price | Q2’22 | Q3’22 | Q4’22 | Q1’23 | Q2’23 |
| Copper price realized – Cu (Comex) $/Lbs | 4.32 | 3.51 | 3.63 | 4.05 | 3.85 |
| Silver price Realized – Ag $/oz | 22.65 | 19.10 | 21.25 | 22.53 | 24.26 |
| Molybdenum price realized – Mo $/Lbs | 18.30 | 16.00 | 21.17 | 32.04 | 20.87 |
| Zinc price $/Lbs | 1.78 | 1.48 | 1.36 | 1.42 | 1.15 |
| Gold $/oz | 1,872 | 1,728 | 1,729 | 1,889 | 1,978 |
Copper Production for Q2’23 was 501.62 Cu M lbs and 502.78 Cu M lbs, including third party. The copper price was $3.85 per Lb in Q2’23 (see table above).
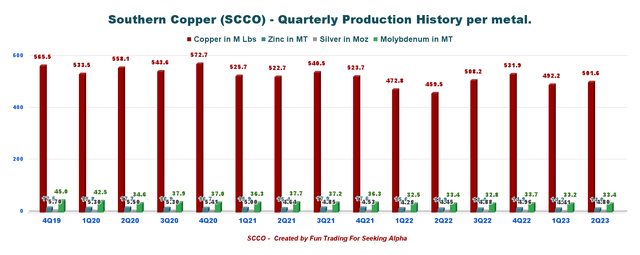
SCCO Quarterly Production per Metal History (Fun Trading)
| Production Au Oz | Q2’22 | Q3’22 | Q4’22 | Q1’23 | Q2’23 |
| Production Copper M Lbs | 459.5 | 508.2 | 531.9 | 492.2 | 501.6 |
| Production incl. 3rd party concentrate | 520.5 | 508.7 | 532.3 | 492.9 | 502.8 |
| Production Molybdenum M Lbs | 13.9 | 13.4 | 14.9 | 14.2 | 14.0 |
| Production of Silver K oz | 4.45 | 4.88 | 4.96 | 4.41 | 4.80 |
| Production of Zinc M Lbs | 33.4 | 32.8 | 33.7 | 33.2 | 33.4 |
From Fun Trading Files
Copper production registered an increase of 9.2% in Q2’23 in a quarter-on-quarter terms to stand at 227,533 tons. Our quarterly result reflects higher production at all of our operations.
By-product production: Mined zinc production increased 13.8% this quarter due to higher production at the Charcas and Santa Barbara units. This was partially offset by lower production at the San Martin mine. Total mined silver production rose 8.0% in Q2’23 driven by higher production at all our operations. Molybdenum production registered a slight increase of 0.2% in Q2’23 compared to Q2’22.
Technical Analysis and Commentary
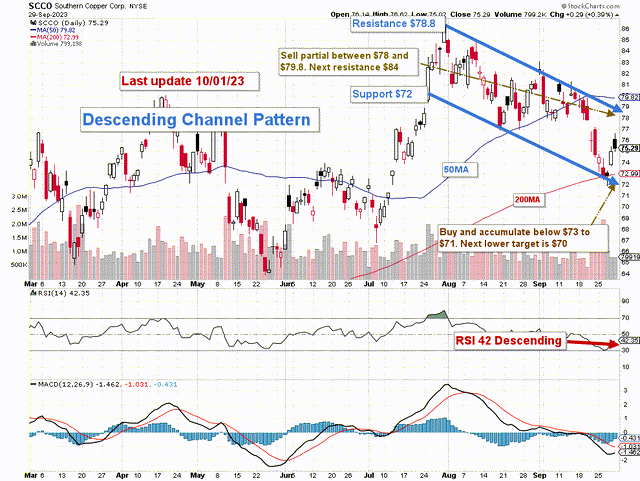
SCCO TA Chart (Fun Trading StockCharts)
Note: The chart is adjusted for the dividend.
SCCO forms a descending channel pattern with resistance at $78.8 and support at $72.
Descending channel patterns are short-term bearish in that a stock moves lower within a descending channel, but they often form within longer-term uptrends as continuation patterns. The descending channel pattern is often followed by higher prices, but only after an upside penetration of the upper trend line. The stock will continue channeling downward until it is able to break either the upper or lower trend line.
The overall strategy is to keep a medium core long-term position and use about 50% to trade LIFO while waiting for a higher final price target to sell your core position. The task is more manageable, knowing that SCCO pays a quarterly dividend of $1.00 per share.
I recommend selling about 50% of your position LIFO (assuming a profit, never sell at a loss) between $78 and $79.8 with possible higher resistance at $84 if the copper price turns bullish unexpectedly well above $4.25 in 2023.
Conversely, I recommend buying SCCO at or between $73 and $71, with potential lower support at $70.
Warning: The TA chart must be updated frequently to be relevant. It is what I am doing in my stock tracker. The chart above has a possible validity of about a week. Remember, the TA chart is a tool only to help you adopt the right strategy. It is not a way to foresee the future. No one and nothing can.
Read the full article here


Leave a Reply