Research Summary
Have you ever wanted to rate the ratings agencies themselves? I sure did.. so today I will be covering one of the major ones right here on Seeking Alpha!
This is my first coverage of Moody’s (NYSE:MCO), a stock in the financials sector, subsector of financial exchanges & data.
Some of the data used will come from their most recent FY2023 Q2 earnings release on July 24th, and some will come from Seeking Alpha or other sources.
Besides being the well-known ratings agency, here are a few other relevant points from their website that I think could be interesting to readers: roots go back to 1900, stock listed on the NYSE. Two key business segments are Moody’s Analytics which provides financial intelligence and analytical tools, and Moody’s Investor Service which rates the credit risk of companies.
Two key peers of this company in the ratings game are Fitch Ratings and Standard & Poors, traded as S&P Global (SPGI).
Rating Methodology
Using a streamlined, structured process, I break down my overall holistic rating of this stock into 5 categories I rank individually and of equal weight: dividends, valuation, share price, earnings growth, company financial health.
If I recommend this stock on at least 3 of 5 categories, it gets a hold rating. 4 of 5 gets a buy, and less than 3 gets a sell rating. Then I compare my rating to the consensus from analysts, Wall Street, and the SA quant system.
Then, I explain any upside or downside risks to my outlook.
Dividends
In this category, I will analyze the dividends of this stock and whether I think they present an opportunity for dividend-income investors. The data comes from official Seeking Alpha dividend info.
As of the writing of this analysis, the forward dividend yield is 0.88%, with a payout of $0.77 per share on a quarterly basis, with a most recent ex-date of Aug. 17th. The yield, in my opinion, is by itself not so impressive being less than 1%, as lately in this financial sector I have seen some past 4%.
However, let’s see how it compares to its overall industry.
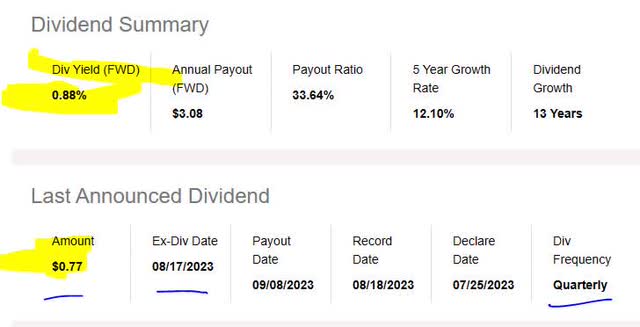
Moody’s – dividend yield (Seeking Alpha)
When comparing to its sector average, this dividend yield is an astounding 77% below its sector average.
I believe this is a negative point to consider for dividend investors who are comparing multiple stocks in which to invest. In my opinion, my target range is 2.5% – 5.5%, to stay within a few points of the sector average. In this case, the yield seems extremely low, and even got an “F” grade from Seeking Alpha which does not add confidence to my sentiment.
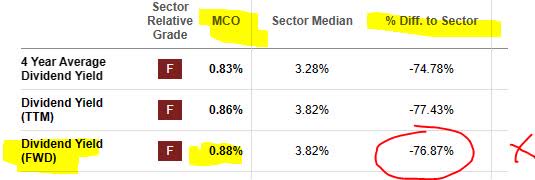
Moodys – div yield vs sector (Seeking Alpha)
On a brighter note, though, I will mention that in looking at the 5-year dividend growth for this stock, it has shown a positive growth trend. This is, in my opinion, a positive for dividend investors and a sign of this firm’s capacity to return capital back to shareholders over a longer-term period.
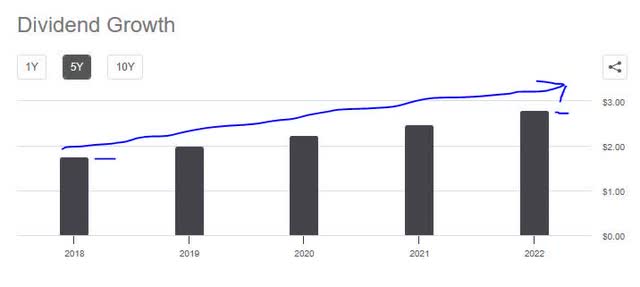
Moodys – dividend 5 year growth (Seeking Alpha)
Additionally, I am looking for stability with dividend payouts, and this stock has shown regular dividend payment history lately without interruption, according to the table below which shows the payouts and the ex-dates.
You will notice the payout amount went up twice in this period.
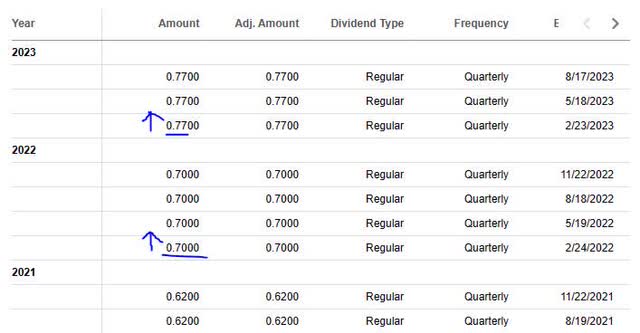
Moodys – div history (Seeking Alpha)
In my analyst opinion, although the dividend yield is not competitive with the overall sector, what makes up for it is the 5 year dividend growth and the stable history of payouts, plus the dividend increase earlier in 2023.
I would therefore recommend this company on the category of dividends.
Valuation
In this category, I will analyze the valuation of this stock. The data comes from official valuation info on Seeking Alpha, specifically the forward P/E ratio and forward P/B ratio, the key metrics I look at as I want to see how much the market is willing to pay for this stock in relation to its earnings and book value.
This stock has a forward P/E ratio of 38.44, which is a massive 293% above its sector average.
I think that a reasonable price to earnings for this stock would be between 8x earnings and 11x earnings, to stay within a reasonable 2-point range of the average. In this case, on this metric the stock appears extremely overvalued vs its overall sector, and I am not confident about its “F” grade from Seeking Alpha.
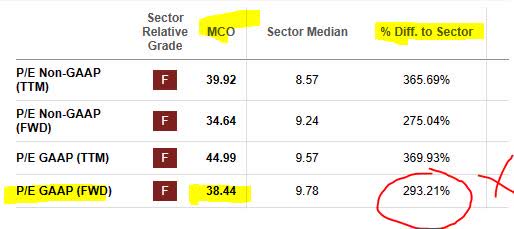
Moodys – P/E ratio (Seeking Alpha)
Now, let’s see if the price to book value is more reasonable. This stock has a forward P/B ratio of 18.07, which is 1,682% above its sector average.
I think that a reasonable price-to-book value for this stock would be between 0.50x book value and 1.5x book value, to stay within a 1/2 point range of the average. In this situation, this stock appears extremely overvalued vs its overall sector, again earning an “F” grade from Seeking Alpha.

Moodys – P/B ratio (Seeking Alpha)
Because both key metrics show overvaluation right now and based on the examples I gave, I would not recommend this stock on the basis of valuation, but would hope that the valuation comes down somewhat.
Share Price
Next, I determine if the current share price is a potential buying opportunity based on my portfolio goal of buying at current price, holding for 1 year until Aug. 2024, and achieving an unrealized gain of +10%.
The price chart (as of the writing of this article) shows a share price of $343.73, compared to its 200-day simple moving average “SMA” of $315.62, over the last 1-year period. I like using the 200-day SMA as it is a long-term trend indicator that smooths out the trend nicely.
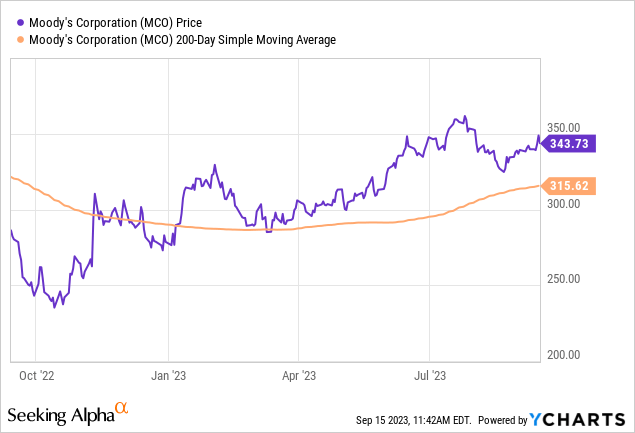
Next, I plug in the current SMA and share price into the following simulator I created, which simulates unrealized gains & losses if the share price as of Aug. 2024 reaches +10% above the current SMA but also if it drops -10% below the current SMA:

Moodys – investing idea simulation (author analysis)
In the above simulation, my goal is to meet or exceed a +10% unrealized gain in 1 year, and I have a maximum loss tolerance of -10% unrealized loss.
Based on the simulation results testing the current buy price, I miss my goal for capital gains by 9%. In addition, I exceed my limit for capital loss by 7.36%.
To better explain my simulation, I highlighted my “trading range” for this stock in the chart below (blue arrows) that is +/- 10% from the moving average. As you can see, the current share price is near the top of this range.
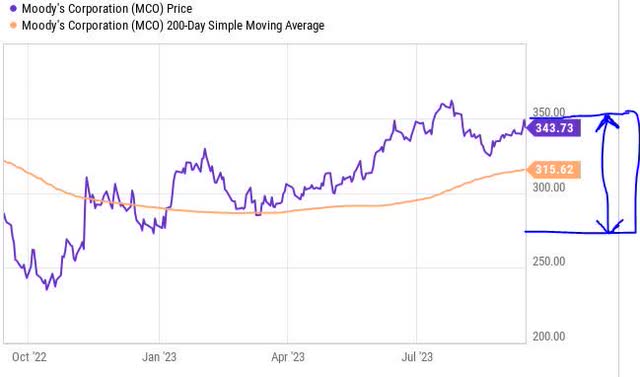
Moodys – investing idea – trading range (author analysis)
In this case, I would not recommend the current buying price.
Since every investor has different profit goals and risk profiles, consider this simulator just a general framework to help think about this stock in a longer-term sense, and of course the actual gains or losses could move beyond just a 10% range.
Earnings Growth
In this category, I examine the earnings trends over the last year, looking at both top-line and bottom-line results but also any relevant company commentary from the last earnings results.
First, I like the YoY positive revenue growth this firm has achieved. In fact, since Sept 2022 it has grown for three straight quarters, so it appears the firm is on a longer revenue uptrend.

Moodys – revenue YoY growth (Seeking Alpha)
The bottom line looked just as good, showing YoY growth in net income.

Moodys – net income YoY (Seeking Alpha)
To help me understand how it performed across its different business segments, I turned to the following graphic from their Q2 earnings release, which shows growth in both the analytics and investor service segment. In addition, I am impressed by the positive earnings-per-share outlook for FY2023.
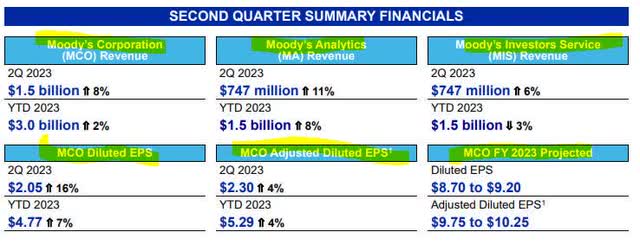
Moodys – segment performance (company Q2 earnings release)
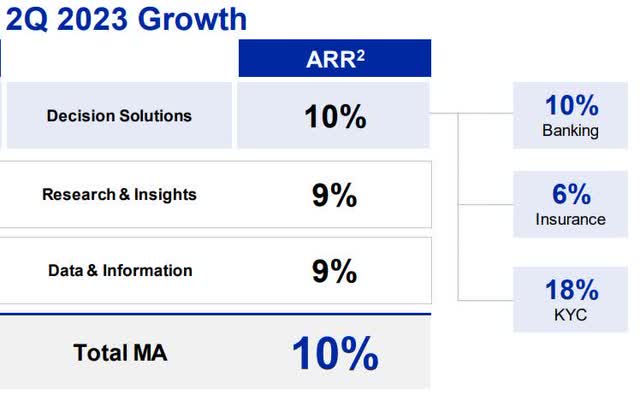
I also want to turn your attention to the following which shows the Moody’s Analytics business segment, which is not the ratings agency but the data/intelligence segment, achieving annual recurring revenue “ARR” across the banking & insurance industry.
This is a positive sign, in my opinion, that this industry is spending on recurring solutions from this firm but also that there is a demand for data analytics & intelligence, which could point to continued forward demand in this segment as well.
Moodys Analysis – ARR (company q2 presentation)
Based on this evidence as whole, I would recommend in this category and expect continued strong results in the next quarter that meet or exceed the prior results, since the firm seems to have the momentum already.
Financial Health
In this category, I will discuss whether the overall company shows strong financial fundamentals beyond just things like dividends, valuation, earnings and share price, with a focus on the capital strength.
One positive item to call out is, according to their Q2 presentation, their full year 2023 outlook is: free cash flow $1.6 – $1.8B, and share repurchases approximately $500MM.
These are both great data points, in my opinion.
Further, this graphic below shows growth in free cash flow in the six months ended June 30th, vs the same period a year prior.

Moodys – free cashflow (company q2 presentation)
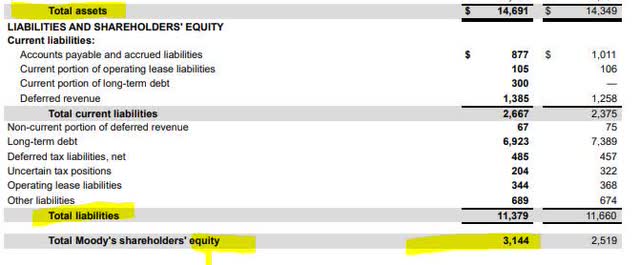
Further, it is worth looking briefly at their balance sheet, which in the following graphic compares Q2 with Q42022 and shows positive equity, as their $14.6B of assets is well in excess of $11.4B in total liabilities. I bring this up because in my opinion it is a sign of financial health, along with free cashflow I already mentioned. Also, I would point out that their long-term debt has gone down it seems, since the end of 2022.
Moodys – balance sheet (company q2 earnings release)
Based on the data, I recommend in this category, and consider it a firm with solid fundamentals.
Rating Score
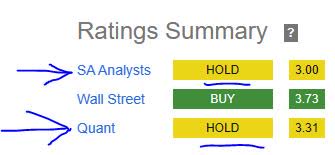
Today, this stock was recommended in 3 of my 5 rating categories, earning a hold rating from me today.
This is in line with the consensus rating from both SA analysts and the SA quant system, but less bullish than the Wall Street consensus.
Moodys – rating consensus (Seeking Alpha)
My Rating vs Downside & Upside Risk
My neutral rating can face a downside risk as follows:
The inflated valuation levels I mentioned could cause increased bearish sentiment going forward among other analysts and investors. For instance, SA analyst Felix Fung in his July 26th article already was highlighting this issue:
I do not think the overextended valuation is sustainable and a reversion to levels near the historical average could translate to meaningful downside potential.
While I agree that the valuation is overextended, I don’t think any “pullback” will be that severe very soon, but perhaps modest at first, so my hold rating stands as it is.
My neutral rating can also face an upside risk as follows:
This firm has potential, as it has shown in the following graphic, to further penetrate the $6B+ “current addressable market” in the insurance sector, with its various solutions. This could spur some nice revenue growth figures in the next few quarters, which could make analysts & investors continually bullish on this stock, making my rating overly cautious.

Moodys – insurance sector potential (company Q2 presentation)
However, while that sector does present potential growth for this company, and may fuel the tailwind for more revenue growth going forward, at the same time I believe it will not justify paying the current share price this stock is in and a “modest” pullback will occur.
With that said, I still believe it is not a great “buy” right now but more of a hold.
Analysis Wrapup
To wrap up today’s discussion, here are the key points we went over:
This stock got a hold rating today.
Its positive points are: earnings YoY growth, company financial health, dividends.
The headwinds it faces are: share price, valuation vs sector.
Both upside & downside risks have been addressed.
In closing, what I think sets this firm apart, and why it is not quite a “sell” rating is the huge potential it has with all the “data” in its possession, and the growth potential that presents but also the value proposal.
As I will be attending an “AI” related event this week in southern Europe, which I will likely mention in a subsequent article, I should point out something about that space here too. In its Q2 presentation, one of the company’s key takeaways for the last quarter was:
Embracing the power of Generative AI across the firm; powered by Microsoft and anchored by Moody’s proprietary data, analytics and research.
It will be interesting to see what Moody’s does going forward in that regard, and how this will influence investors’ & analysts’ sentiments as well.
Read the full article here




Leave a Reply