The last three months have been a tough and frustrating time for the tech bulls. Apple’s (AAPL) chart looks unattractive, Tesla (TSLA) shares have run into steep post-earnings selling, and the major semiconductor chip stocks have felt pressure from macro headwinds. Still, we are embarking on what has been a historically bullish stretch of the calendar and volatility is a bit high.
This is the ideal setup for Global X Nasdaq 100 Covered Call & Growth ETF (NASDAQ:QYLG). I will outline the strategy of this fund and why conditions appear ripe for using this vehicle in light of recent market price action and the look ahead.
QYLG Outperforms QQQ During the Recent Correction
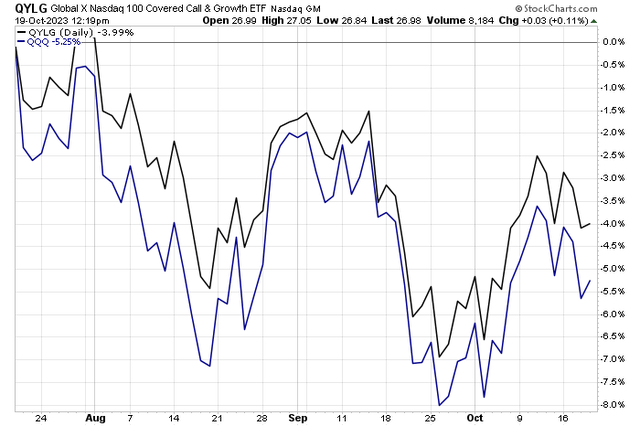
Stockcharts.com
According to Global X, QYLG follows a “covered call” or “buy-write” strategy, in which the fund buys the stocks in the Nasdaq 100 Index and “writes” or “sells” corresponding call options on approximately 50% of the value of the portfolio of stocks in the same index. It seeks to generate income by writing covered calls on the underlying index by writing calls on half of the portfolio, the strategy allows investors to capture half the upside potential of the underlying index. This is a key difference compared to other funds that follow 1-for-1 covered calls.
Here’s how to think of it: If you are bullish on the Nasdaq 100 ETF (QQQ), but don’t expect a major rally over the coming weeks or months, then QYLG can be an appropriate choice. If you are less sanguine, then the Global X NASDAQ 100 Covered Call ETF (QYLD) could be your preferred vehicle. If you are very upbeat about where the Nasdaq 100 goes, then simply buying QQQ or even a leveraged-long tech-focused ETF may be suitable.
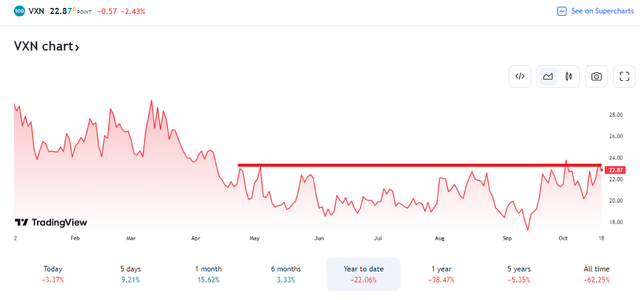
So, we are getting quite nuanced here with some of these equity ETFs! Here’s why I assert that QYLG looks to be a happy medium. As of October 19, 2023, the Nasdaq 100 Volatility Index (VXN) is right at key resistance near 23. If history holds, and VXN backs off, then simply collecting premiums at currently high prices is wise. But I also see an upside to QQQ and the broader market over the final two-plus months given a correction that has been ongoing now for nearly two months since the late-July peak in both the S&P 500 and Nasdaq 100.
Nasdaq 100 Volatility Index: Near Key Resistance
TradingView
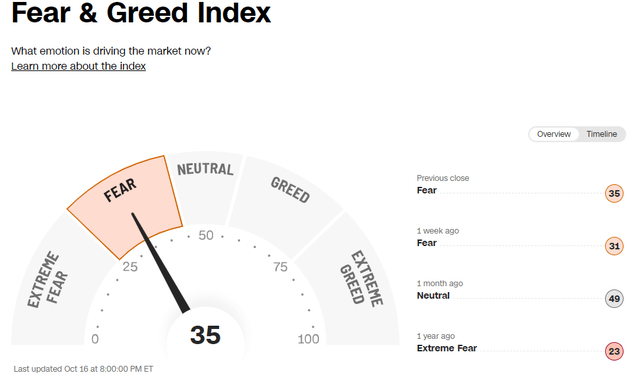
What’s more, there’s heightened fear in the marketplace according to a host of sentiment indicators. The CNN Fear & Greed Index is among them, and this reading is just what the bulls may want to see today as bullish seasonality gets underway. I will detail that later.
Investors Too Bearish?
CNN
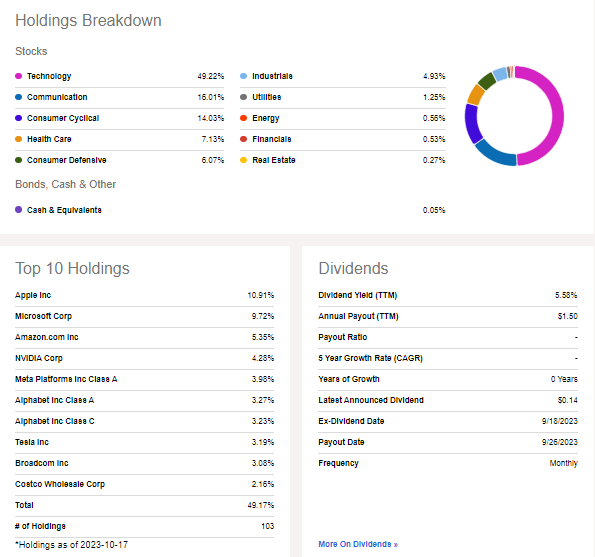
Now let’s focus on the QYLG portfolio. You will see that the Information Technology sector dominates, of course. The strongest sector year-to-date, Communication Services, is the second-largest sector component, while there is scant exposure to traditional value sectors. Prospective investors should be aware that the top 10 holdings comprise nearly half the fund’s equity allocation. The current yield is more than 5.5% and QYLG’s annual expense ratio is moderate at 0.60% (about half a percentage point above the expense ratio of long-only index ETFs).
QYLG remains a small fund as its assets under management are just $107 million and liquidity is not strong. Global X notes that the median 30-day bid/ask spread is wide at 0.33% – so using limit orders is prudent. Where QYLG shines, however, is with its very strong momentum and ETF Grade. As of this writing, the ETF is the top-ranked fund in its asset class and in the top 10% overall nontraditional equity ETFs. A key risk is how the tech space reacts to key earnings reports due out later this month and in November.
QYLG Portfolio & Dividend Information
Seeking Alpha
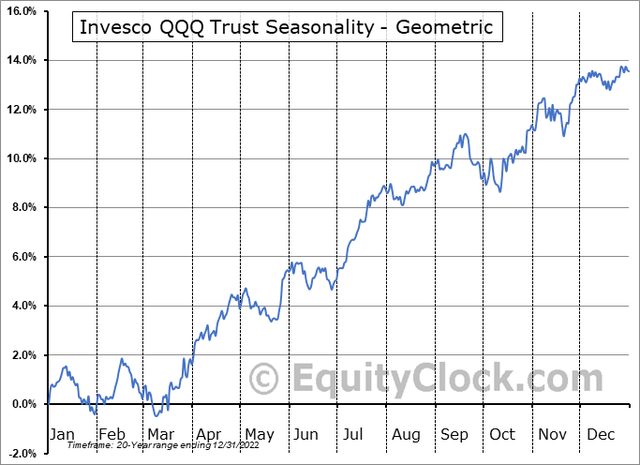
Seasonally, QQQ tends to rally from late October through mid-January, but the rise is nothing out of the ordinary compared to its usual historical tendency, according to data from Equity Clock. To me, this suggests that owning a product like QYLG could work since selling calls while retaining some upside potential in the QQQ ETF.
QQQ Seasonality: Moderate Strength Late October Through Mid-January
Equity Clock
The Technical Take
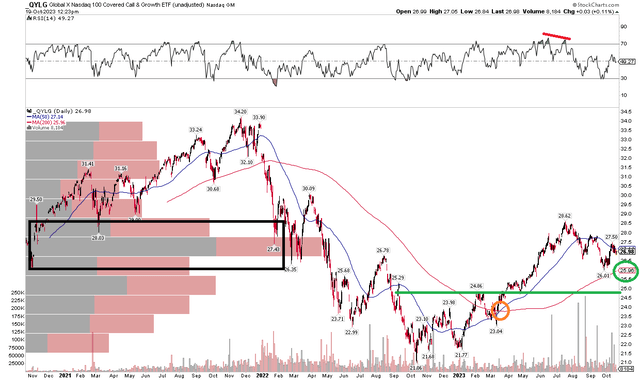
With QYLG being right in the sweet spot of offering some upside potential in the QQQ with a beefed-up yield care of its 50%-exposure covered call feature, the chart has no serious issues. I concede that performing technical analysis on a high-yield stock fund is not as useful as doing so on non-yielding products, but notice in the chart below that QYLG appears to be in a garden-variety correction off the summer high.
I see support near $25 and at the September low of $26. The long-term 200-day moving average also comes into play at $26, and its positive slope suggests the bulls are in control. There is, though, a high amount of volume by price near current price levels, so I would like to see the fund climb above $28 to help support the notion of new cycle highs.
Overall, while the fund is lower from three months ago, the bulls have defended support, and the long-term trend remains higher.
QYLG: Holding Mid-$20s Support, Rising Long-Term Trend
StockCharts.com
The Bottom Line
I have a buy rating on QYLG looking ahead to the next few months. The fund offers more upside on QQQ than QYLD while still collecting some option premiums. So, it’s ideal for investors who are moderately bullish on QQQ.
Read the full article here


Leave a Reply