Invesco QQQ Trust ETF (NASDAQ:QQQ) experienced a decline in Q3 2023 but still outpaced the S&P 500’s return. QQQ has also impressively outperformed the S&P 500 by a notable margin from year to date. The Federal Reserve’s actions and policies heavily influenced the financial landscape during this period. Market participants were keenly attentive to the Federal Open Market Committee’s (FOMC) decisions regarding rate adjustments. The ETF’s standout performance is attributed mainly to its investments in the Consumer Discretionary, Telecommunications, and Technology sectors. This article provides an in-depth analysis of the QQQ ETF, building on the insights from the previous piece. The goal is to determine the future trajectory of QQQ and identify potential investment avenues for long-term investors. While the stock price is undergoing a downward correction after meeting its price objectives, such corrections are considered potential buying opportunities for investors.
Unraveling the Future Path of QQQ ETF and Opportunities for Long-Term Investors
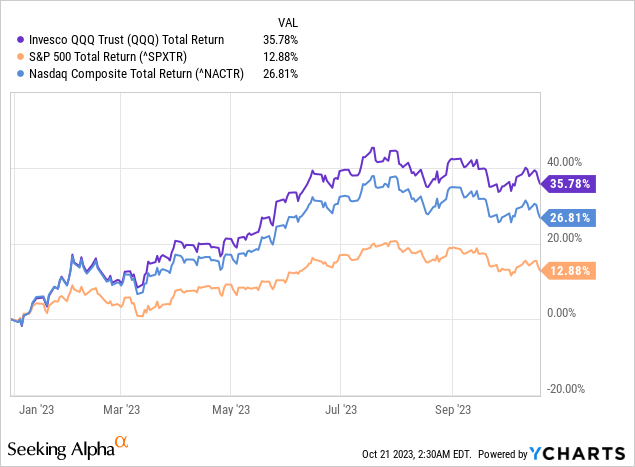
QQQ ETF experienced a decline of 2.91% in Q3 2023, but it still managed to outpace the S&P 500 and Nasdaq Composite total return. QQQ has remarkably outperformed with a total return of 35.78% compared to the S&P 500’s 12.88%, a lead of more than 22 percentage points, as shown in the chart below. The Federal Reserve’s actions and policies significantly influenced the financial landscape during this period. The FOMC had the financial world in suspense, with investors continuously speculating about the timing and quantity of potential rate hikes. Additionally, specific price metrics showed a notable year-over-year acceleration during the summer months, leading to discussions about the duration the Fed might maintain the interest rates.
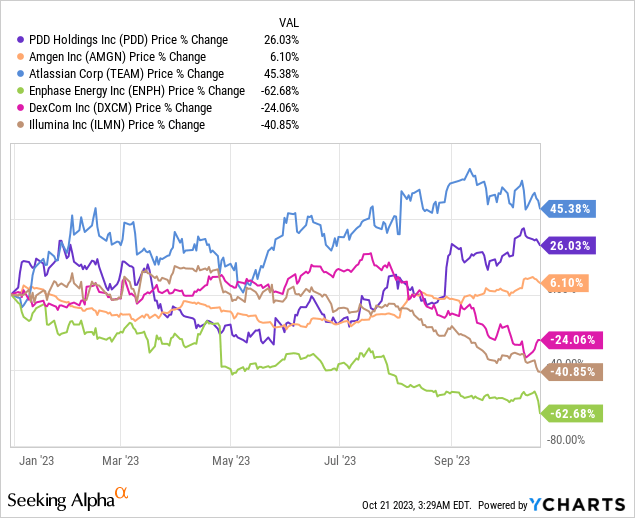
Moreover, QQQ’s performance has been bolstered by its strong positioning in the Consumer Discretionary, Telecommunications, and Technology sectors, per the Industry Classification Benchmark (ICB). Notably, the Technology and Consumer Discretionary sectors have been pivotal for QQQ’s relative performance throughout the year, with average weights of 58.42% and 19.02%, respectively, and impressive total returns of 49.36% and 40.68% (until 30 September 2023). Delving deeper into stock-specific performances, NVIDIA Corporation (NVDA) and Meta Platforms, Inc. (META) emerged as the top performers in QQQ year-to-date. NVIDIA witnessed a staggering growth of 197.76% for the year, spurred by robust Q2 earnings, where the company reported a revenue of $13.51 billion, a substantial year-over-year growth of 102%. On the other hand, Meta Platforms enjoyed growth of 149.47% year-to-date, with its Q2 earnings report highlighting a revenue of approximately $32 billion, marking an 11% year-over-year growth—the first time the company achieved a growth rate surpassing 10% since Q4 2021. The best-performing stocks in QQQ from the year to date are PDD Holdings Inc. (PDD) (+26.03%), Amgen Inc. (AMGN) (+6.10%), and Atlassian Corp. (TEAM) (+45.38%). The worst performers for the quarter were Enphase Energy, Inc. (ENPH) (-62.68%), DexCom, Inc. (DXCM) (-24.06%), and Illumina, Inc. (ILMN) (-40.85%), as shown in the chart below.
Moreover, Q3 2023 performance seemed to pivot away from AI optimism to uncertainty on future Fed action to combat price pressures. Signals in the economy remain mixed with an improvement in prices, albeit slowly, while still above the Fed’s long-term target of 2%.
During Q3 2023, FOMC met in July and September 2023. The July meeting witnessed a significant decision as the committee raised its benchmark rate by 25 basis points, positioning it at 5.25 – 5.50%, the highest over two decades. This decision contrasted the previous “Fed pause” in June, which maintained the rate, marking the first time since March 2022. Jerome Powell, the Chairman, expressed optimism, indicating no forecasts of a recession for the latter half of the year. This led to market speculation on the possibility of a soft economic landing and potential future rate decisions. By September, the Fed maintained the rate at its current level. The month also revealed the Fed’s dot plot, hinting at another rate hike by year’s end. In terms of inflation, there were mixed signals. June’s CPI reflected a 3.0% YoY growth, moderating from May’s 4.0%. This trend changed with July’s 3.2% and August’s rapid 3.7% YoY growth. Monthly data mirrored this, with August seeing a notable 0.7% increase. A significant factor was the rise in energy prices, with oil prices surging by over 28.5% during the quarter due to tight supply and production cut decisions by major oil producers. Excluding volatile components like food and energy, the Core CPI displayed a steady trend, with August recording a 4.3% YoY increase, even as energy prices influenced sectors like air travel.
Technical Price Examination for QQQ
Recap
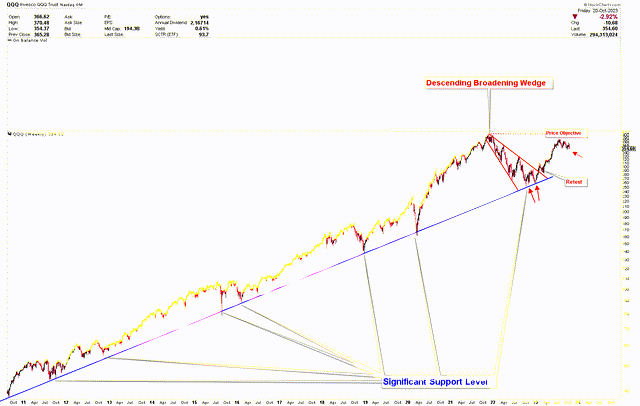
The technical outlook was explored in a previous article, highlighting a pronounced bullish trend in price movement. This was underscored by a rebound off the long-term trendline and a descending broadening wedge pattern. Based on these factors, it was suggested that investors might see QQQ ETF as a compelling buy, given the potential for a robust breakout from this wedge. There was a breakout as anticipated, and the price surged to higher levels to achieve price objectives. Subsequently, another potent buy signal emerged in the QQQ ETF, signaling another robust rally. This was confirmed when the price retraced to the support line of the descending broadening wedge and then surged again. The subsequent forecast expected further price appreciation, targeting the $400 mark associated with the wedge pattern. Currently, the price is at $387.42, undergoing consolidation in this bracket.
Current Price Development
The updated weekly chart from the previous discussion shows that the stock price has met its target from the descending broadening wedge formation and is now consolidating at elevated levels. This phase of price stabilization suggests an upcoming price surge. This consolidation stems from the stock price hitting the goals set by the breakout from the descending broadening wedge pattern. The broader price trajectory continues to be firmly bullish. The double bottom formation observed in Q4 2023 is a significant historical pattern that could pave the way for the next shift in QQQ ETF.
QQQ Weekly Chart (StockCharts.com)
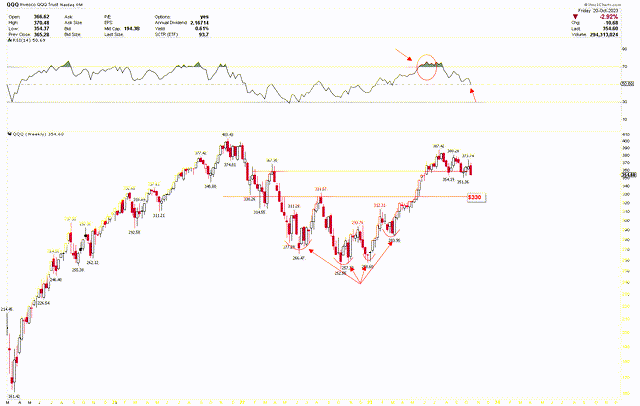
Additionally, the weekly chart shows an inverted head and shoulders pattern, with the head at $252.55 and the shoulders at $266.47 and $283.95. This pattern’s head is reinforced by a double bottom at $252.55 and $258.60. The neckline, situated at $330, has been breached, leading the price to meet its targets. The secondary resistance near $360 has also been broken, consolidating the price at higher levels. The recent price adjustments in the market show the enduring strength of bullish momentum, priming the market for a future rally. The weekly chart reveals a robust support zone around $330, which could be optimal for increasing long positions.
QQQ Weekly Chart (StockCharts.com)
For a more granular look at this bullish trend and its recent consolidation, the short-term daily chart showcases a bull flag emerging from the peak of $387.42. This flag signifies positive price movement and underscores the constructive nature of current price action. A dip to $340-$330 further emphasizes the solid support at this range, which could be an ideal entry point for long-term investors. However, if there’s a substantial decline, the market has a pivotal solid support of around $250.
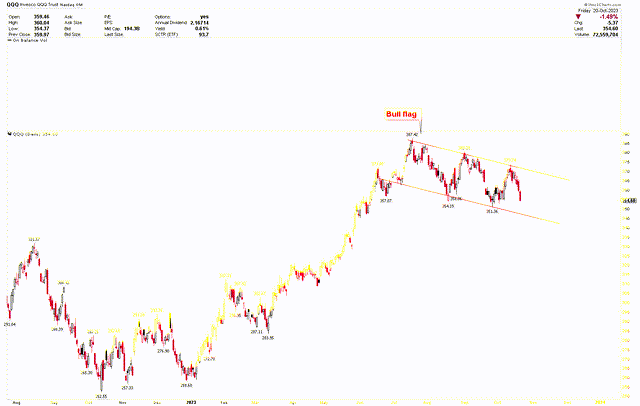
QQQ Daily Chart (StockCharts.com)
Market Risk
The Federal Reserve’s decisions on interest rates remain crucial, with unexpected hikes potentially causing market volatility affecting QQQ’s performance. The ongoing concerns about inflation and the Fed’s response could adversely influence consumer purchasing power and corporate profitability. Concurrently, while QQQ has benefited from its emphasis on the Technology and Consumer Discretionary sectors, a downturn in these areas might significantly impact the ETF. The escalating energy prices, driven by limited supply and significant oil producers’ decisions, can affect several sectors, including air travel, and global supply chain disruptions further introduce uncertainties.
From a technical perspective, QQQ’s overall bullish trend requires investors to monitor vital support and resistance points. The $330 level is strong support, but any substantial dip might push the market toward the $250 threshold. A breach below $250 could challenge the prevailing optimistic outlook.
Bottom Line
QQQ ETF witnessed a slight decline but outperformed the S&P 500. This performance is attributed to its significant investments in the Consumer Discretionary, Telecommunications, and Technology sectors, with firms like NVIDIA and Meta Platforms playing a crucial role in this growth. Stocks like PDD Holdings Inc., Amgen Inc., and Atlassian Corp stood out, whereas Enphase Energy Inc., Dexcom Inc., and Illumina Inc. underperformed. The financial landscape during this period was considerably influenced by the Federal Reserve’s decisions, particularly concerning interest rate adjustments. The technical outlook for QQQ remains bullish, with the price stabilizing at higher levels after meeting targets set by previous patterns. However, potential market risks include unexpected interest rate hikes by the Federal Reserve, inflation concerns, and disruptions in the global supply chain. From a technical standpoint, while the $330 mark acts as a solid support, a breach below $250 could challenge the current bullish outlook for QQQ. Investors should remain vigilant, considering both the opportunities and challenges in the current market environment.
Read the full article here


Leave a Reply