This dividend exchange-traded fund, or ETF, article series aims at evaluating products regarding the relative past performance of their strategies and quality of their current portfolios. As holdings and their weights change over time, reviews may be updated when necessary.
PID strategy and portfolio
Invesco International Dividend Achievers ETF (NASDAQ:PID) started investing operations on 09/15/2005 and tracks the NASDAQ International Dividend Achievers Index. As of writing, it has 49 holdings, a 12-month distribution yield of 3.34% and a total expense ratio of 0.53%.
As described in the prospectus by Invesco, the underlying index selects companies that:
- Are listed in the U.S., and in some cases on the LSE in London.
- Are incorporated outside the U.S. and countries of beneficial interest.
- Have increased their annual dividends each of the last five years.
- Have an average daily dollar trading volume of at least $1 million.
- Have not entered an agreement or proceeding resulting in ineligibility.
The weighting methodology is based on the 12-month dividend yield with a maximum weight of 4% per constituent. The index is reconstituted once a year in March and rebalanced quarterly. A constituent may be excluded at any time if it becomes ineligible. In this case, it is not replaced until the next reconstitution.
I will compare PID with SPDR® S&P Global Dividend ETF (WDIV) by looking into their portfolio structure, valuation and performance. These funds share some characteristics:
- global portfolio of dividend paying companies,
- dividend growth screening,
- yield in a 3% to 5% range,
- no hedge against currency risks.
They also show some differences: the dividend growth screening is more restrictive for WDIV (10 consecutive years) than for PID (5 consecutive years), and a few other ones detailed along this article. WDIV was reviewed here. Both funds pay quarterly distributions. The next table compares yields, fees, assets under management (“AUM”) and average daily volumes in dollar value.
|
PID |
WDIV |
|
|
Yield ((TTM)) |
3.34% |
4.99% |
|
Expense ratio |
0.53% |
0.40% |
|
AUM |
$1.06B |
$223.29M |
|
Average daily volume |
$3.38M |
$748.09K |
PID is larger and more liquid, but both funds have sufficient assets and volumes for long-term investors.
Both funds are mostly invested in large companies, yet WDIV is more balanced in size segments. PID has 80% of assets in large/mega caps and totally ignores small caps.
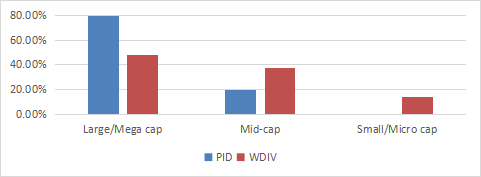
Size segments (chart: author; data: Fidelity.)
Canada is the top country for both funds, with a big difference: PID is massively overweight in this country, which weighs 58.6% of asset value. The next chart plots the top countries, representing 97.7% of assets for PID and 94.9% for WDIV.
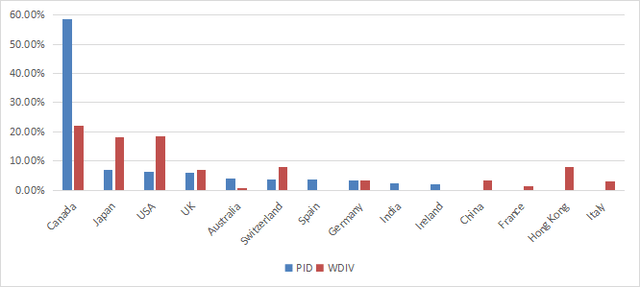
Geographical allocation (chart: author: data: Invesco, SSGA)
PID concentration in Canada is a consequence of the New York or London listing requirement. It is a strong limitation compared to other international funds. Despite a strategy excluding companies incorporated in the U.S., it shows up in third position with 6.4% of assets. Indeed, several large global companies classified as American are incorporated overseas, in particular in Ireland.
WDIV is much more diversified geographically. On the downside, its exposure to geopolitical and regulatory risks related to China is higher: the aggregate weight of China, Hong Kong and Taiwan is 12.6%.
The heaviest sector is financials in both funds, and WDIV is really overweight (25.7%). PID is more balanced across sectors. Comparing them, WDIV overweights real estate, consumer staples, financials, and industrials. PID is much heavier than its peer in healthcare, energy, and to a lesser extent in utilities, materials, communication and technology.
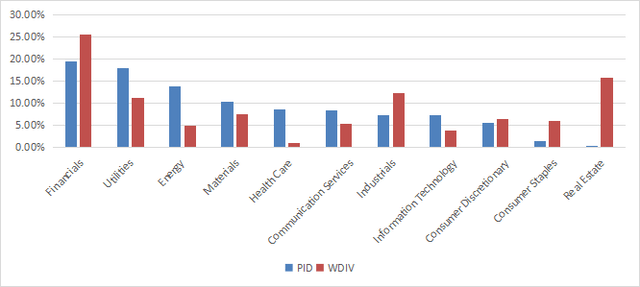
Sector Breakdown (chart: author: data: Invesco, SSGA)
PID and WDIV have 49 and 90 holdings, respectively. The top 10 names of each, listed below, represent 37.3% and 16.5% of asset value. WDIV is clearly more diversified in constituents. Looking at their weights, risks related to individual companies are moderate for PID (maximum about 4%) and low for WDIV (maximum about 2%).
|
PID top 10 |
Ticker (US) |
Weight% |
WDIV top 10 |
Ticker (Local) |
Weight% |
|
|
Rio Tinto PLC ADR |
RIO |
4.25 |
A2A SPA |
A2A |
2.07 |
|
|
Canadian Imperial Bank of Commerce |
CM |
3.82 |
ADECCO GROUP AG REG |
ADEN |
2.01 |
|
|
Enbridge Inc |
ENB |
3.80 |
SUMITOMO FORESTRY CO LTD |
1911 |
1.79 |
|
|
Canadian Natural Resources Ltd |
CNQ |
3.79 |
LENOVO GROUP LTD |
992 |
1.69 |
|
|
Toronto-Dominion Bank/The |
TD |
3.71 |
TOYO SEIKAN GROUP HOLDINGS |
5901 |
1.67 |
|
|
TC Energy Corp |
TRP |
3.67 |
TOYO TIRE CORP |
5105 |
1.56 |
|
|
Atlantica Sustainable Infrastructure PLC |
AY |
3.65 |
BOUYGUES SA |
EN |
1.48 |
|
|
BCE Inc |
BCE |
3.59 |
KEYERA CORP |
KEY |
1.46 |
|
|
Sumitomo Mitsui Financial Group Inc ADR |
SMFG |
3.56 |
RUSSEL METALS INC |
RUS |
1.42 |
|
|
TELUS Corp |
TU |
3.50 |
NEW WORLD DEVELOPMENT |
17 |
1.34 |
PID is more expensive than WDIV regarding valuation ratios, as reported in the next table. A note of caution: these metrics may be biased by sector breakdowns and geographical allocations. For example, financials, which are heavier in WDIV, have lower and less reliable ratios than other sectors. Moreover, every country has a discount or premium related to perceived risks in its economic and political situation.
|
PID |
WDIV |
|
|
Price / Earnings TTM |
17.44 |
11.93 |
|
Price / Book |
1.73 |
1.06 |
|
Price / Sales |
1.79 |
0.75 |
|
Price / Cash Flow |
8.25 |
7.56 |
Performance
The next chart compares total returns since WDIV inception in June 2013. WDIV is ahead, but the difference in annualized return is below 1%.
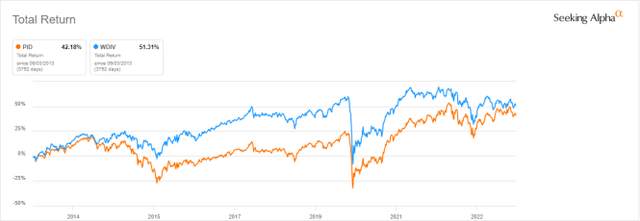
Total returns since June 2013 (Seeking Alpha)
However, PID has outperformed its competitor by 28% in the last 3 years (next chart).
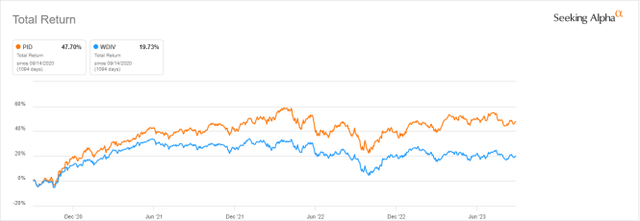
Total returns, last 3 years (Seeking Alpha)
The next table evaluates dividend growth between 2014 and 2022.
|
Annual div. /share |
PID |
WDIV |
|
2014 |
0.69 |
3.07 |
|
2022 |
0.55 |
3.00 |
|
8-year variation |
-20.29% |
-2.28% |
Both funds show an 8-year downtrend in distributions, whereas the cumulative inflation has been about 26% in the same time. Since 2014, the dollar index has gone up by about 30%. It doesn’t change anything for U.S. investors, but it shows a less depressing picture from a global point of view. Even then, WDIV distributions have just kept pace with inflation, and PID still is far below.
Takeaway
Invesco International Dividend Achievers ETF invests in international stocks with growing dividends. The next table recapitulates a comparison with SPDR S&P Global Dividend ETF, which follows the same kind of strategy.
|
winner |
|
|
Expense ratio |
WDIV |
|
Inception date |
PID |
|
Liquidity |
PID |
|
Diversification |
WDIV |
|
Geopolitics |
PID |
|
Valuation |
WDIV |
|
Return |
PID |
|
Yield |
WDIV |
|
Dividend growth |
WDIV |
If we count one point by line, WDIV comes first by a short margin. However, you may want to give different weights to these criteria and make your own score. Anyway, none of these funds looks really attractive regarding price and distribution history. Indeed, both dividend-growth strategies have resulted in decreasing distributions between 2014 and 2022.
Read the full article here