Invesco’s High Yield Equity Dividend Achievers ETF (NASDAQ:PEY) is a fund that’s been around a while having launched back in 2004, competing in a crowded dividend ETF space and more recently short-term treasuries. It targets 50 stocks from the Nasdaq US Broad Dividend Achievers Index. To qualify for inclusion, stocks must have increased their annual dividend payment for at least 10 years and meet a minimum market capitalization of $1 billion. Top holdings are heavy in consumer staples followed by a healthy dose of financials. Altria (MO) marks the top spot with a 3.38% allocation. The top 40% holdings are listed in the following table.
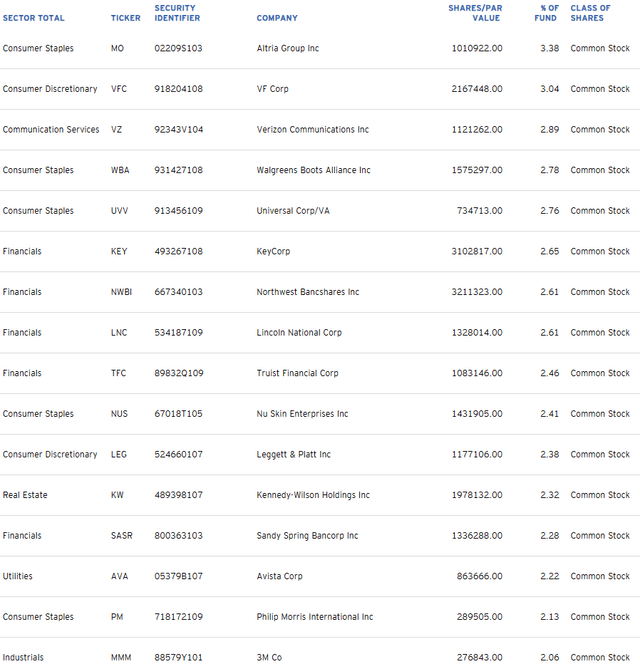
PEY Top 40% Holdings (invesco.com)
Performance vs. Market
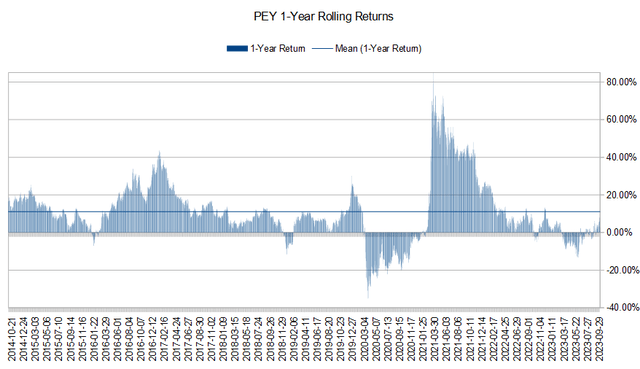
The following chart shows 1-year rolling returns for PEY over the last 10 years and includes 2,266 individual data points instead of a singular start and end date.
PEY 1-Year Rolling Returns (Michael Thomas)
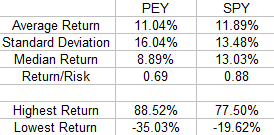
Over the time period, PEY has achieved a double-digit average return at 11.04% with a standard deviation of 16.04%. That compares well to the market benchmark SPDR S&P 500 ETF (SPY) returns over the same period. The large post-pandemic effect is also evident. The following table shows the return metric comparison for both funds.
PEY 1-Year Return Metrics vs. SPY (Michael Thomas)
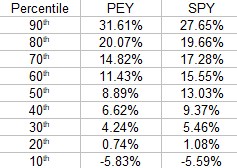
While the market benchmark has a more favorable return/risk profile, PEY does its job of producing a high yield with a current 4.78% dividend yield vs. SPY’s 1.52%. So for an income-focused investor, the volatility spread of 256 basis points is worth the extra 3.26% yield over SPY. However, timing is a more important factor when opening a position in PEY as its median return of 8.89% sits well below its average. The following table shows the comparison of percentile distribution for 1-year returns for both funds.
PEY 1-Year Return Percentiles vs. SPY (Michael Thomas)
From the table, the average return for PEY of 11.04% is closer to the 60th percentile while SPY’s average return of 11.89% sits between the 40% and 50% percentile ranges. This again shows picking an entry point for PEY is an important factor in determining future returns.
Dividends
One key characteristic that many income investors will find attractive for PEY is that it pays dividends monthly. The following chart highlights the dividend history of PEY over the last 10 years, showing the 12-month rolling dividend distribution.
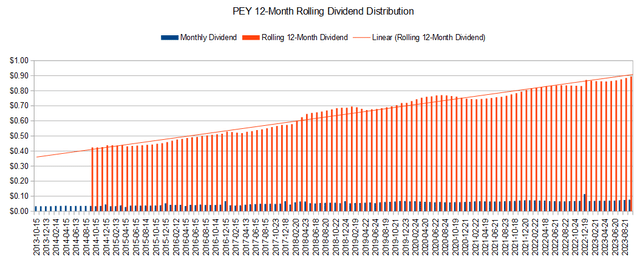
PEY Rolling 12-Month Dividend Distribution (Michael Thomas)
With an upward trendline it’s clear PEY is indeed continually increasing dividend distributions. The equation for the trendline, although not shown, has a slope of 0.00458x and indicates an average annual dividend growth rate of ~5.50%. The following table shows the dividend distribution by year along with the year-over-year growth rate.
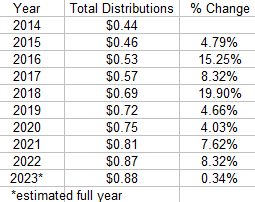
PEY Annual Dividend Distribution (Michael Thomas)
The average annual growth rate using figures from the table is 8.14%, but it’s easy to see the influence of high growth rates in 2016 and 2018. The 5.50% growth rate using the trendline is likely a more accurate measure of what can be expected going forward. Note that the annual distribution for the remainder of 2023 is estimated and the low growth between 2022 and 2023 is due to the abnormally large monthly payout in December 2022. It’s uncertain whether this unusually high payout will repeat in 2023.
Adding the current yield of 4.78% to the expected dividend growth rate of 5.50% produces 10.28% and a respectable predicted rate of return.
Peer Comparison
We’ve already shown that PEY’s performance compared to SPY, factoring in volatility and dividends, is adequate. Next, we compare PEY to some peer funds to gauge relative performance. The following table highlights 1-year rolling return metrics for PEY and popular comparisons according to etf.com over the last decade.

PEY Peer Performance Comparison (Michael Thomas)
The comparison reveals that PEY achieves the highest average return of 11.04% but also comes with the highest standard deviation of 16.04% and the highest maximum drawdown of -35.03%. If the goal is getting to an end destination without regard for how it is reached, PEY would be the top choice. Risk-averse investors might start looking at other funds. But this is only part of the decision as income is just as important as total return for these particular ETFs. The following table shows dividend growth comparisons and uses data from Seeking Alpha. Note that is why results for PEY vary slightly from the individual analysis performed earlier. Current yield and dividend growth rates for 3, 5, and 10-year periods are shown along with the trailing 12-month growth rate. Growth rates are averaged, excluding the trailing 12-month rate, and used to calculate the yield plus growth figures.

PEY Dividend Yield + Growth vs. Peers (Michael Thomas)
Invesco’s PEY along with WisdomTree’s DHS are the only two funds in the list with monthly distributions that may be more attractive to income-focused investors. PEY takes the top spot for current yield and DHS takes the top spot for yield plus growth.
Conclusion
Although the normalization of interest rates of US treasuries yielding over 5% may draw some attention away from equity income funds, they do lack the growth component that equity funds offer. In a prior article, ” Do Dividend ETFs Produce Better Total Return Compared To SPY? | Seeking Alpha”, I analyzed the total return performance of popular dividend-themed ETFs vs. the S&P 500 to determine if they held any edge. One key conclusion was that in the world of dividend-themed ETFs, those having strong dividend growth components did produce better returns when factoring in risk. With that in mind, the Invesco High Yield Equity Dividend Achiever ETF is a solid choice with a competitive high yield and dividend growth rate for income-focused investors.
Read the full article here





Leave a Reply