Market overview
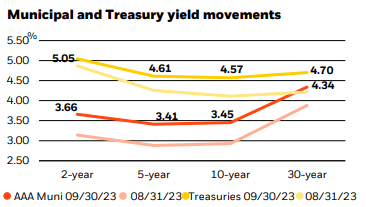
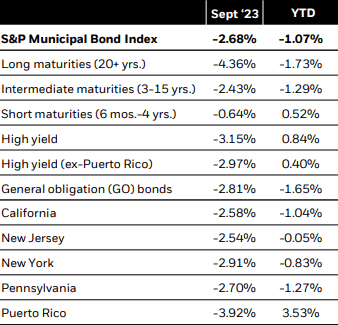
Municipal bonds posted sharply negative total returns in September amid heightened volatility. Interest rates rose rapidly and pressured fixed income assets as the market navigated a moderate rise in inflation, continued strength in the labor market, surging oil prices, and more hawkish-than-expected message from the Federal Reserve (Fed). The asset class, dragged down by rich valuations and less favorable supply-and-demand dynamics, lagged versus comparable Treasuries. The S&P Municipal Bond Index returned -2.68%, bringing the year-to-date total return to – 1.07%. Shorter-duration (i.e., less sensitive to interest rate changes), AA-rated bonds and the corporate-backed, utility, and transportation sectors performed best.
Issuance was light at just $28 billion, 23% below the five-year average, bringing the year-to-date total to $263 billion, down 8% year-over-year. However, issuance still outpaced reinvestment income from maturities, calls, and coupons by nearly $6 billion, weighing heavily on the market as seasonal net negative supply during the summer months yielded to net positive supply. As a result, deals were oversubscribed just 3.2 times on average, the lowest total since February. At the same time, investors displayed caution as interest rates rose, and mutual fund flows were increasingly negative, exacerbated by a pickup in tax loss selling late in the month.
While the recent sell-off was significantly larger and more volatile than expected, seasonal performance weakness in the autumn was broadly anticipated. With the Fed nearing the end of its tightening cycle, we view the reset in yields and valuations as an attractive long-term buying opportunity. We foresee using any material pickup in issuance to add some duration and lock in durable yields.
Strategy insights
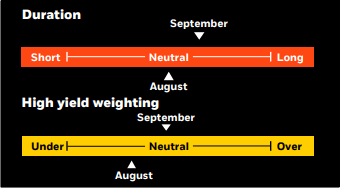
We maintain a neutral-duration posture overall, albeit slightly longer than last month. We prefer an up-in-quality bias and remain both cautious and selective in noninvestment grade. We advocate a barbell yield curve strategy, pairing front-end exposure with an increased but modest allocation to the 15-20-year part of the curve.

Overweight
- Essential-service revenue bonds
- Select highest-quality state and local issuers with broadest tax support
- Flagship universities
- Select issuers in the high yield space
Underweight
- Speculative projects with weak sponsorship, unproven technology, or unsound feasibility studies
- Senior living and long-term care facilities in saturated markets
- Lower-rated private universities
- Stand-alone and rural health providers
Credit headlines
Last month, Moody’s revised its credit outlook to ‘positive’ from ‘stable’ for the New York Metropolitan Transportation Authority’s (MTA) $20.6 billion in outstanding transportation revenue bonds. Moody’s also affirmed the MTA’s ‘A3’ rating. S&P followed with a rating upgrade to ‘A-‘ from ‘BBB+’ and revised its outlook to ‘positive’ from ‘stable’ on October 4th. Additional state support has offset post-COVID-19 ridership losses and has enabled the MTA to nearly close forecasted budget gaps and stabilize liquidity. Weekday subway ridership on the nation’s largest mass-transit system has slowly risen but remains at about 70% of 2019 levels. To offset fare losses, a state-approved 0.6% increase in New York City payroll taxes will provide an estimated $5 billion of revenue over the next five years. Continued support from the state, a full recovery of ridership, and the implementation of operational savings are key factors in any future rating upgrades.
A recent rating downgrade of a small issuer highlights the importance of credit research and the need to analyze an issuer’s entire debt structure prior to purchase. For example, S&P downgraded Maryland Heights, MO from ‘BBB’ to ‘BB+’ last month based on the city’s refusal to support its nonrated 2018B Industrial Development Authority revenue bonds. The city was rated ‘AA+’ as recently as November 2020. The 2018B bonds were secured by revenues from a multipurpose ice arena that never became fully operational due to the COVID-19 pandemic. The ice facility has faced operating imbalances since its opening in 2019, having relied on general fund transfers from the city to make debt payments on three separate occasions. Given the city’s recent decision not to provide additional support for the ice complex bonds, S&P has become wary of the city’s willingness to pay its outstanding debt backed by annual appropriations. This technical default by a previously highly rated city underscores the need for in-depth credit analysis.

BlackRock, Bloomberg.
Municipal performance

S&P Indexes.
Investment involves risk. The two main risks related to fixed income investing are interest rate risk and credit risk. Typically, when interest rates rise, there is a corresponding decline in the market value of bonds. Credit risk refers to the possibility that the issuer of the bond will not be able to make principal and interest payments. There may be less information available on the financial condition of issuers of municipal securities than for public corporations. The market for municipal bonds may be less liquid than for taxable bonds. A portion of the income from tax-exempt bonds may be taxable. Some investors may be subject to Alternative Minimum Tax (AMT). Capital gains distributions, if any, are taxable. Index performance is shown for illustrative purposes only. You cannot invest directly in an index. Past performance is no guarantee of future results.
This material is not intended to be relied upon as a forecast, research or investment advice, and is not a recommendation, offer or solicitation to buy or sell any securities or to adopt any investment strategy. The opinions expressed are as of October 6, 2023, and may change as subsequent conditions vary. The information and opinions contained in this material are derived from proprietary and nonproprietary sources deemed by BlackRock to be reliable, are not necessarily all-inclusive and are not guaranteed as to accuracy. There is no guarantee that any forecasts made will come to pass. Any investments named within this material may not necessarily be held in any accounts managed by BlackRock. Reliance upon information in this material is at the sole discretion of the reader.
©2023 BlackRock, Inc or its affiliates. All Rights Reserved. BlackRock is a trademark of BlackRock, Inc or its affiliates. All other trademarks are those of their respective owners.
Prepared by BlackRock Investments, LLC, member FINRA
Not FDIC Insured • May Lose Value • No Bank Guarantee
This post originally appeared on the iShares Market Insights.
Read the full article here


Leave a Reply