In our previous assessment of Nvidia Corporation (NASDAQ:NVDA), we believed the company’s commitment to innovation in the data center, representing 75% of its revenues, was evident in notable launches like integrated CPUs/GPUs, networking expansions, and software solutions. The ongoing product roadmap positioned Nvidia competitively, whereas Advanced Micro Devices, Inc. (AMD) lacked roadmap updates for MI300x, and Intel’s (INTC) Gaudi-4 was set for 2024. Overall, we believe Nvidia’s continuous development underscored its focus on performance and portfolio expansion, surpassing AMD and Intel in partnerships, product breadth, and performance. We forecasted a total 3-year forward average of 53%, primarily driven by a 60.9% average growth in the Data Center segment.
The company’s 126% revenue growth in 2023 blew past our estimates of 88% growth. In this review, we delved into the company’s performance post its full-year 2023 earnings release, which exceeded our earlier predictions, to assess the sustainability of its notable growth. Initially, we analyze the factors contributing to the company’s outperformance by comparing actual growth in each segment with our forecasts. Additionally, we focus on Nvidia’s Data Center segment, shedding light on Sovereign AI as an emerging growth catalyst and providing an analysis of the segment’s growth prospects along with our outlook. Furthermore, we revised our growth projections for the remaining segments and determined the sustainable growth rate for each of them.
2023 Revenue Growth Review
|
Nvidia Revenue Breakdown ($ mln) (CY2023) |
Our Previous Forecast |
Actual |
|
Data Center |
38,367 |
47,566 |
|
Growth % |
156% |
217.00% |
|
Gaming |
9,501 |
10,427 |
|
Growth % |
4.80% |
15.00% |
|
Professional Visualization |
1,277 |
1,559 |
|
Growth % |
-17.30% |
1.00% |
|
Automotive |
1,201 |
1,093 |
|
Growth % |
33.00% |
21.00% |
|
OEM and Other |
265 |
277 |
|
Growth % |
-41.80% |
-39.11% |
|
Total |
50,610 |
60,922 |
|
Growth % |
87.60% |
125.85% |
Source: Company Data, Khaveen Investments.
For the full year of 2023, Nvidia’s actual revenues came in higher than we had previously forecasted at $60.9 bln with a growth rate of 125.85% compared to our previous forecast of $50.6 bln with a growth rate of 87.6%.
Data Center
The Data Center segment reported actual revenues of $47.57 bln with a growth rate of 217%, surpassing our forecast of $38.37 bln with a 156% growth. This is as Data Center segment growth accelerated in Q4 with a growth rate of 411% YoY in the quarter as management highlighted its growth for the segment driven by its “NVIDIA Hopper GPU computing platform along with InfiniBand end-to-end networking”. Specifically, management highlighted growth driven by “training and inferencing of generative AI and large language models.” Nevertheless, we had previously anticipated the strong demand for the company’s H100 from major cloud service providers to support their AI infrastructure expansion and thus is not novel to our understanding of the company’s data center segment.
The company also highlighted several developments relating to the segment including the new partnership with Amazon AWS to adopt Nvidia’s DGX Cloud systems in AWS (AMZN). This is not unexpected as Nvidia already has partnerships with the rest of the top cloud providers such as Microsoft (MSFT), Google (GOOG), Alibaba (BABA), IBM (IBM) and Oracle (ORCL). However, Nvidia’s new partnership is significant as AWS is the largest cloud provider with a market share of 34% in the cloud market. We compiled the top cloud provider partnerships to compare between Nvidia, Intel, and AMD in the table below.
|
Cloud Provider Partnership |
Nvidia |
Intel |
AMD |
|
AWS |
Yes |
Yes |
Yes |
|
Microsoft Azure |
Yes |
Yes |
Yes |
|
Google Cloud |
Yes |
Yes |
Yes |
|
Alibaba Cloud |
Yes |
Yes |
Yes |
|
IBM Cloud |
Yes |
Yes |
Yes |
|
Oracle Cloud |
Yes |
Yes |
Yes |
Source: Company Data, Khaveen Investments.
As seen above, all 3 companies have partnerships with the top cloud providers. Furthermore, in comparison with its key competitors, AMD and Intel are also partners of AWS but their partnerships focus on server CPUs including AMD’s EPYC and Intel’s Xeon Scalable processors. Nvidia’s partnership is more extensive as it covers a range of GPUs, CPUs and Nvidia Software offerings as the company will be the first cloud provider to adopt Nvidia’s GH200 Grace Hopper Superchips which integrates its Arm-based Grace CPU and Hopper GPU technologies. Besides that, Nvidia is partnering with AWS in Project Ceiba to design “the world’s fastest GPU-powered AI supercomputer” to be used by Nvidia’s own R&D team.
Moreover, AWS will also be adopting future generations of Nvidia GPUs in its cloud including H200 (offering significant performance enhancement over H100) and L40S, which we highlighted in our last analysis of its roadmap, as well as Nvidia Omniverse software applications. We compiled the products sold by the top companies to examine their strength of partnership.
Source: Company Data, Khaveen Investments.
As seen above, Nvidia’s partnerships with the top cloud providers are more extensive compared to Intel and AMD in terms of the products sold to the cloud providers. Nvidia’s partnerships mainly involve its GPU products as well as Nvidia AI Enterprise software offerings to their cloud customers whereas Intel and AMD’s partnerships are mainly focused on server CPUs. However, Nvidia highlighted that AWS is the first cloud provider to adopt its GH200 Superchip which integrates its new server CPUs and thus we expect could expand to other cloud providers as well in the future as it was introduced in H2 2023.
Overall, we believe the main reason for its revenue growth outperformance in Q4 besides strong demand for its Hopper and Infiniband chips is due to its extensive partnership win with AWS encompassing a broad range of Nvidia products including GPUs, CPUs and Nvidia Enterprise Software for AI. This is also as we previously highlighted that we believe Nvidia to be the “King of Data Centers” due to its product breadth advantage with a full stack of data center solutions as its strength against AMD and Intel, which we believe allows it to have extensive partnerships with other cloud providers as well.
Gaming
In the Gaming segment, actual revenues were $10.43 bln and a growth rate of 15%, slightly exceeding our forecast of $9.50 bln with a growth rate of 4.80%. This is as the segment’s revenue growth in Q4 2024 accelerated to 27.9% YoY. This is as the company benefitted from the GPU market recovery in PC as PC sales rebounded to H2 2023 as covered in our previous analyses. According to JPR Research, the strong PC GPU shipment sequential growth of 6% in Q4 2023 and 24% YoY indicates the market strong GPU market recovery.
Furthermore, the company also highlighted that its growth in the segment was better than its outlook on demand for its RTX gaming GPUs during the holiday season. The gaming market is cyclical, as Q4 2023 revenue is typically much higher in November and December in particular compared to the rest of the year which coincides with the holiday season. For example, in 2023, the December gaming market revenue increased by 95% to $7.9 bln compared to October 2023. The chart below clearly shows the seasonality effect which explains the recent quarter surge in gaming revenue, leading to a full year 15% revenue increase vs our projections of 4.8% (which did not account for seasonality).
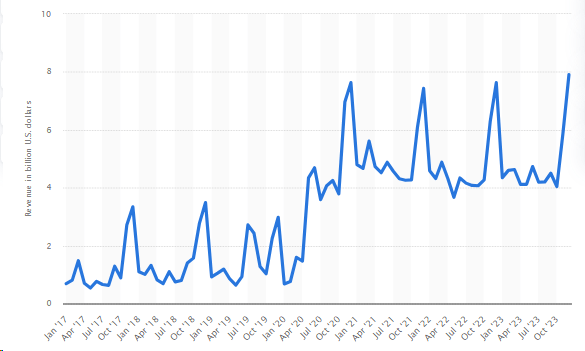
US Gaming Market Revenue (Statista)
Professional Visualization
The Professional Visualization segment also outperformed our previous forecast with actual revenues of $1.56 bln (1% growth) compared to our forecast of $1.28 bln (-17.30%) in 2023. This is as its Q4 2023 segment revenue increased by 105%. The company highlighted that its latest RTX Ada architecture GPU sales continued to ramp up during the quarter as enterprises upgraded their workstations to support generative AI. Based on the average retail price of its RTX40 series of $770, we estimate the company sold 0.6 mln GPUs in Q4 2023, an increase of 11% QoQ compared to 0.54 mln. Therefore, we believe the outperformance in Q4 2023 growth was due to the ramp-up of RTX chips for workstation customers.
Automotive
In the Automotive segment, actual revenues were $1.09 bln (20% growth), slightly below our forecast of $1.20 bln (33% growth). This is because automotive revenue was down during the quarter by 4% YoY. In the previous earnings call, Nvidia’s management highlighted that the automotive segment experienced a slowdown due to lower automotive market demand in China in particular. However, total automotive sales growth in China was higher in 2023 overall at 12% (vs 2% in 2022) and 14% YoY in Q4 2023. Thus, we believe the underperformance of the segment was not primarily attributed to the slowdown in the Chinese automotive market.
Additionally, the total share of vehicles with ADAS Level 3 and below capabilities had increased to 55% in 2023 from 50% in 2021. However, the global top automotive ADAS chipmakers’ growth slowed down in 2023 to 14% compared to 30.4% in the table below, indicating a market slowdown. According to Mobileye (MBLY), Tier 1 automaker customers have built up an excess inventory of chips following the supply crunch in 2021 and have reduced orders as they manage through their high inventories. Global automotive production has been higher than automotive unit sales since 2022 and again in 2023 with 2 mln excess production based on S&P estimates of 86 mln unit sales and automotive production of 88 mln. Therefore, we believe the main reason for Nvidia’s underperformance is due to the automakers scaling back chip orders to manage their inventory oversupply.
|
Automotive Segment Revenue Comparison |
2019 |
2020 |
2021 |
2022 |
2023 |
Average |
|
Mobileye (Intel) |
879 |
967 |
1,386 |
1,869 |
2,079 |
|
|
Growth % |
10.0% |
43.3% |
34.8% |
11.2% |
24.9% |
|
|
Nvidia |
700 |
536 |
566 |
903 |
1,080 |
|
|
Growth % |
-23.4% |
5.6% |
59.5% |
19.6% |
15.3% |
|
|
Qualcomm |
684 |
714 |
1,098 |
1,500 |
1,872 |
|
|
Growth % |
4.4% |
53.8% |
36.6% |
24.8% |
29.9% |
|
|
NXP |
4,212 |
3,825 |
5,493 |
6,879 |
7,447 |
|
|
Growth % |
-9.2% |
43.6% |
25.2% |
8.3% |
17.0% |
|
|
Texas Instruments |
3,020 |
2,892 |
3,852 |
5,007 |
5,956 |
|
|
Growth % |
-4.2% |
33.2% |
30.0% |
19.0% |
19.5% |
|
|
Total |
9,495 |
8,934 |
12,396 |
16,158 |
18,434 |
|
|
Growth % |
-5.9% |
38.7% |
30.4% |
14.1% |
19.3% |
Source: Company Data, Khaveen Investments.
OEM and Other
Finally, the OEM & Other segment includes revenue generated through Nvidia’s OEM partnerships, licensing agreements, and other revenue streams not covered in other segments. However, it represents a very minor portion of Nvidia’s revenues and was in line with our previous forecast.
Conclusion
Overall, our full-year growth forecast for Nvidia in 2023 was off the mark with actual growth of 126% compared to 87.6%. The company’s revenue growth accelerated in Q4 2023 with a growth rate of 268% YoY in the final quarter of the year, leading to the difference in our forecast expectations as we had assumed the Q3 YTD YoY growth rates to forecast each segment. Furthermore, management also highlighted that Q4 revenues surpassed its guidance by $2.1 bln of $20 bln.
The segment with the largest differences was Data Center with an actual full-year growth of 217% compared to our previous forecast of 156%. That said, this outperformance is not entirely surprising as we had anticipated strong growth for Nvidia’s Data Center segment as our previous analysis already established the company is the leader in data centers for AI due to its superior product breadth with a full stack of data center products and a robust product development roadmap. However, we believe a key reason for its outperformance in Q4 was also due to its new partnership with AWS covering an extensive range of products from GPUs, and CPUs to its AI software solutions.
Thus, our analysis builds on our understanding of Nvidia’s Data Center segment as it now has extensive partnerships with all of the top cloud providers which we believe supports its outlook in Data Center as these cloud providers scale up their infrastructure to support AI development. As we highlighted previously, these cloud providers host infrastructure that consists of various chips including CPUs, GPUs and interconnects which are needed for training and inference of large AI models.
Sovereign AI
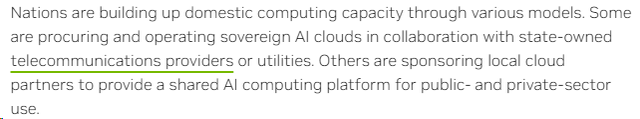
Nvidia has highlighted the term “Sovereign AI” in its earnings briefing and that the company sees it as another demand driver for its growth. According to Nvidia, “sovereign AI refers to a nation’s capabilities to produce artificial intelligence using its own infrastructure, data, workforce and business networks.” Countries are increasingly investing in domestic data center infrastructure to support and spur the development of AI in their respective countries as highlighted by Nvidia’s CEO in the quote below.
Countries around the world are investing in AI infrastructure to support the building of large-language models in their own language, on domestic data and in support of their local research and enterprise ecosystems. – Jensen Huang, President & CEO.
Furthermore, we compiled and analyzed the subsidies provided by the governments of other countries to ICT, AI, and Data Center infrastructure to determine the opportunity for sovereign AI to Nvidia.
Source: Khaveen Investments.
Based on the table above, the U.S. will allocate $25 bln in 2024’s budget for “emerging technologies,” such as the opening of National Labs that include supercomputers. Furthermore, India’s government is investing $40 bln in data centers to make India a global data center hub over the next 5 years. Similarly, Thailand’s government has invited top cloud providers (AWS, Google, Microsoft) to help build data centers in the country, with a total investment of $8.5 bln over 15 years. Based on our compilation, we calculated an average of $22.8 bln per year on subsidies for ICT and Data Centers. In comparison, this is still relatively small compared to the total IT spending of $372.93 bln per year of the countries we examined, indicating the allocated subsidies could further rise in the future.
Nvidia
Nvidia highlighted that countries’ governments are supporting their domestic data computing capabilities with the rise of AI and highlighted the involvement of businesses ranging from state-owned telecom or utility companies to local cloud providers. We examined examples of Nvidia’s partnerships with governments worldwide for sovereign AI, the parties involved and the deal value.
|
Country |
Name of Parties Involved with Nvidia |
Total Amount ($ mln) |
|
USA |
The US National Science Foundation |
92 |
|
India |
The Indian government and major tech companies (Infosys, Reliance, Tata) |
N/A |
|
Singapore |
Singapore’s National Supercomputing Centre, Ministry of Education, Singtel |
N/A |
|
Thailand |
Ministry of Education, a consortium of top universities, the National Science and Technology Development Agency (NSTDA). |
N/A |
|
Saudi Arabia and the UAE |
Saudi Arabia: King Abdullah University of Science and Technology (Kaust) Abu Dhabi: Technology Innovation Institute |
160 |
|
Australia |
CSIRO |
N/A |
|
Europe |
EuroHPC JU, UK universities |
1,513 |
|
Japan |
Ministry of Economy, Trade and Industry (METI), Japan’s NTT, Sakura Internet, NEC, and Softbank |
121 |
|
Total |
2,135 |
Source: Khaveen Investments.
In the table above, we compiled information on Nvidia’s partnerships with sovereign governments and cloud companies working directly with the governments. We estimated that these partnerships could generate a total revenue opportunity of at least $2.1 bln for Nvidia, though the actual figure could be even higher as some countries did not disclose the amount. Among these partnerships, the one between Nvidia and Europe has the highest value of $1.5 bln, attributed to the participating countries in the EuroHPC JU and the UK universities ordering around 30,000 GH200 from Nvidia. In the U.S., Nvidia partnered with the U.S. National Science Foundation to provide data center infrastructure products including its DGX Cloud systems.
|
Cloud Providers Capex ($ mln) |
2019 |
2020 |
2021 |
2022 |
2023 |
2024F |
2025F |
2026F |
2027F |
|
Cloud Market Capex (Adjusted) ($ bln) |
85.0 |
117.4 |
156.1 |
169.4 |
170.2 |
217 |
273 |
339 |
415 |
|
Cloud Market Capex Growth % |
0.1% |
38.1% |
32.9% |
8.5% |
0.49% |
27% |
26% |
24% |
23% |
|
Cloud Infrastructure Services Revenue |
96 |
130 |
178 |
227 |
271 |
342 |
426 |
524 |
637 |
|
Cloud Infrastructure Services Revenue Growth % |
39% |
35% |
37% |
28% |
19% |
26% |
25% |
23% |
22% |
|
Cloud Market Capex/ Market Revenues Growth Factor |
0.00 |
1.09 |
0.88 |
0.31 |
0.03 |
1.05 |
1.05 |
1.05 |
1.05 |
|
Sovereign AI Capex |
22.77 |
22.77 |
22.77 |
22.77 |
|||||
|
Total Market Capex |
240 |
296 |
361 |
438 |
|||||
|
Sovereign AI % of Total Capex |
9.5% |
7.7% |
6.3% |
5.2% |
Source: Company Data, Khaveen Investments.
We updated our estimate of the cloud providers’ capex growth from our previous analysis. Previously, we did not take into account the sovereign AI in our capex estimation by cloud players and projected it based on the cloud market growth with the cloud market capex-to-cloud market revenue factor score. In 2023, the cloud market capex slowed down as the top cloud providers including AWS, Microsoft, Google and Alibaba capex growth slowed down in H1 2023 but recovered in H2 2023 as investments accelerated to support AI infrastructure, ending the year with relatively flattish growth. Based on our updated projections, we estimate the cloud capex to reach $217 bln by 2024.
Additionally, we factored in Sovereign AI capex of $22.77 bln based on our analysis above, which we include to calculate its total capex. In 2024, sovereign AI accounts for 9.5% of the total market capex as subsidized capex for the cloud providers, which we believe could benefit companies including Nvidia. Overall, we derived an average forward cloud capex growth of 25% and sovereign AI growth contribution of an additional 7.2% of total market capex on average.
|
Company Share of Data Center Capex Estimate ($ bln) |
2018 |
2019 |
2020 |
2021 |
2022 |
2023 |
|
Nvidia Data Center Revenues |
2.93 |
2.98 |
6.70 |
10.61 |
15.01 |
47.57 |
|
Nvidia Share of Data Capex Spend |
3.5% |
3.5% |
5.7% |
6.8% |
8.9% |
27.9% |
|
AMD Data Center Revenues |
1.08 |
1.23 |
1.69 |
3.69 |
6.04 |
6.50 |
|
AMD Share of Data Capex Spend |
1.3% |
1.5% |
1.4% |
2.4% |
3.6% |
3.8% |
|
Intel Data Center Revenues |
22.99 |
23.48 |
23.41 |
22.69 |
19.20 |
15.52 |
|
Intel Share of Data Capex Spend |
27.1% |
27.6% |
19.9% |
14.5% |
11.3% |
9.1% |
|
Broadcom Data Center Revenues (AVGO) |
7.19 |
6.60 |
6.56 |
7.75 |
9.81 |
11.9 |
|
Broadcom Share of Data Capex Spend |
8.5% |
7.8% |
5.6% |
5.0% |
5.8% |
7.0% |
|
Marvell Data Center Revenues (MRVL) |
0.81 |
0.85 |
1.04 |
1.78 |
2.41 |
2.20 |
|
Marvell Share of Data Capex Spend |
1.0% |
1.0% |
0.9% |
1.1% |
1.4% |
1.3% |
|
Others |
49.9 |
49.9 |
78.0 |
109.6 |
116.9 |
86.5 |
|
Others Share of Data Capex Spend |
58.8% |
58.7% |
66.5% |
70.2% |
69.0% |
50.8% |
Source: Khaveen Investments.
Additionally, we compiled the share of capex spending of Nvidia, Intel, AMD, Broadcom and Marvell in the table above. As seen above, Nvidia’s share of capex spending had been increasing in the past years and had surged in 2023 to 27.9%. On the other hand, AMD and Broadcom increased slightly while Intel and Marvell’s share fell. Over the past 6 years, the share of other companies of total capex had been rising until 2022 but fell in 2023 mainly due to the rise of Nvidia. In 2023, we believe the decrease in smaller competitors’ share indicates the increasing competitiveness of large players, especially Nvidia.
Conclusion
Overall, we believe sovereign AI could be an additional growth driver for Nvidia’s data center segment as we highlighted its partnerships with government organizations around the world. As countries support data center growth for AI with subsidies, we believe this could benefit the total cloud market capex at an estimated $22 bln per year and support companies such as Nvidia through their partnerships with these cloud providers. Previously, we forecasted the company’s Data Center revenue growth based on our market forecast growth rate of 39% consisting of our base cloud market projections at a forward average of 23% in addition to our AI growth contribution estimates of 16% per year in our AMD analysis. Furthermore, we applied a factor score of 1.5x for Nvidia due to its partnerships, product breadth and performance advantage to forecast a long-term growth rate of an average of 60.9%.
We maintain our forecast for its Data Center segment despite the outperformance in Q4 2023, which we believe was mainly supported by its new partnerships with AWS.
Revenue Growth Outlook of Non-Data Center Segments
In this section, we examine the sustainable baseline growth for its other remaining segments besides Data Center which include Gaming, Professional Visualization and Automotive.
Gaming
In our last analysis, we adjusted our growth forecast for the full year of 2023 based on prorated Q1 to Q3 growth of its Gaming segment which was 4.8%. However, this was lower than its actual growth of 15% YoY due to seasonality.
On the other hand, we previously projected growth for the full year 2023 at 11.6 based on our model accounting for full-year shipments and ASP growth. Therefore, as our full-year long-term projection model was more in line with the actual growth, we believe it is more accurate compared to prorating its quarterly growth.
Previously, we had anticipated growth in the Gaming segment of the company by predicting that Nvidia would expand its share in the GPU market, leveraging its growing value advantage over competitors with an average factor of 1.22x. Our pricing projections were derived from the 2023 two-generation average of 23%, gradually decreasing by 5% annually for a more conservative estimate. Our assumption of declining market shipments was based on our forecasted decline of -11.7% in PC market shipments for 2023 recovering to a long-term GPU shipments CAGR of 3.80% in 2024 and beyond.
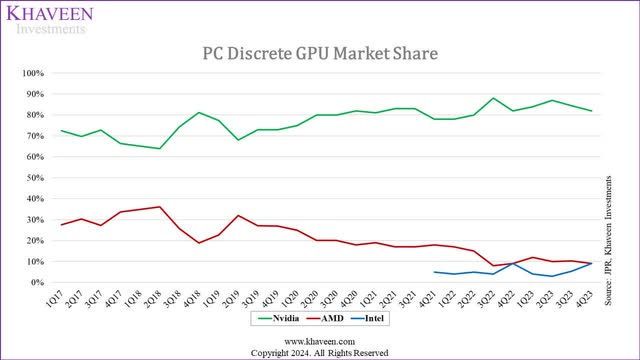
JPR, Khaveen Investments
In 2023, Nvidia’s market share maintained its position as the dominant market leader in the discrete PC GPU market with an average market share of 84%, followed by AMD and Intel.
|
Nvidia Gaming GPU Forecast |
2021 |
2022 |
2023 |
2024F |
2025F |
2026F |
|
Total PC Discrete GPU Market Shipments (‘mln’) (‘a’) |
138.0 |
71.3 |
47.9 |
53.4 |
60.1 |
61.3 |
|
Growth % |
-48.33% |
-32.77% |
11.46% |
12.43% |
2.05% |
|
|
Nvidia Market Share (‘b’) |
81.3% |
82.0% |
84.3% |
91.1% |
93.3% |
93.7% |
|
Nvidia Shipments (‘c’) |
112.1 |
58.5 |
42.73 |
48.68 |
56.05 |
57.45 |
|
Growth % |
-48% |
-26.9% |
13.9% |
15.1% |
2.5% |
|
|
Nvidia Average PC GPU Price ($) (‘d’) |
111.14 |
155.07 |
244.04 |
301.4 |
357.1 |
395.4 |
|
Growth % |
40% |
57% |
23% |
18% |
11% |
|
|
Nvidia Revenue ($ mln) (‘e’) |
12,462 |
9,067 |
10,427 |
14,673 |
20,016 |
22,712 |
|
Growth % |
-27.2% |
15.0% |
40.7% |
36.4% |
13.5% |
* c = a x b; e = d x e
Source: Company Data, Khaveen Investments.
Based on our updated table above, we compiled the estimated discrete GPU market shipments in 2023 which declined by 32% for the full year as the PC market declined by 12.8%. However, Nvidia’s market share improved slightly to 84.3%. Thus, we calculated Nvidia’s GPU shipments to decline by 26.9% in 2023.
On the other hand, we calculated its ASP growth of 57%, which supported its revenue growth. In 2024 and beyond, we updated the total PC discrete market shipments based on our latest PC market projections growth from Intel analysis, seeing a market recovery into 2024. We continue to forecast Nvidia’s market share to increase by accounting for a 1.22x factor score derived based on our past GPU comparison analysis between Nvidia and competitors due to its performance advantage.
Finally, we continue to base our ASP growth forecasts on its past 2 average generation pricing growth of 23% tapered down by 5% per year as a conservative estimate to a long-term market average GPU pricing growth of 11%.
In total, we expect the company’s Gaming segment revenue growth to rebound in 2024 with our expectations of the PC market recovery.
Professional Visualization
In our previous analysis, we prorated its Q1 and Q3 2023 growth which was -17.3% compared to its actual full-year growth of 1%. Before that, we initially based our projections for the segment similarly on the Gaming segment (PC GPU market forecast) as it relates to similar products (RTX GPUs), which was 11% higher than its actual growth rate of 1%. The Professional Visualization segment recovered more slowly as Gaming returned to positive growth (21.7% YoY) in Q2 2023, but Professional Visualization was down by 23.6% and only turned positive in Q3 2023 (108% YoY).
| Gaming vs Prof Visualization Revenue ($ mln) |
2015 |
2016 |
2017 |
2018 |
2019 |
2020 |
2021 |
2022 |
2023 |
2024 |
Average |
|
Gaming |
2,058 |
2,818 |
4,060 |
5,513 |
6,250 |
5,518 |
7,759 |
12,462 |
9,067 |
10,427 |
|
|
Growth % (YoY) |
36.20% |
36.93% |
44.07% |
35.79% |
13.37% |
-11.71% |
40.61% |
60.61% |
-27.24% |
15.00% |
24.4% |
|
Professional Visualization |
795 |
750 |
835 |
934 |
1,130 |
1,212 |
1,053 |
2,111 |
1,544 |
1,559 |
|
|
Growth % (YoY) |
0.76% |
-5.66% |
11.33% |
11.86% |
20.99% |
7.26% |
-13.12% |
100.47% |
-26.86% |
1.00% |
10.8% |
Source: Company Data, Khaveen Investments.
Based on the table above, we compared the growth of the Gaming and Professional Visualization segments. We see the average growth of Gaming being much higher than Professional Visualization at 24.4% and 10.8% in the past 10 years. Furthermore, both Gaming and Professional Visualization growth was only similar in 2023, experiencing a decline of around 27%. However, in all other periods, the Professional Visualization segment growth had been very different from the Gaming segment growth and does not appear to be correlated.
Therefore, we believe that this indicates a low correlation between the two segments’ growth and have switched our projections for Professional Visualization to be based on its historical average as a more reflective growth forecast. This is because out of the past 10 years, there were 8 years that the Professional Visualization segment growth was closer to the historical average of the segment (10.8%) compared to Gaming (24.4%). We believe this could be due to the different customer base despite the similar products sold as Gaming caters to the PC gaming market while Professional Visualization caters to workstations for business and enterprise customers.
We believe the stronger growth in the PC gaming market is due to the consumer demand driver for better graphics quality in video games and video streaming compared to enterprise customers using GPUs for work in tasks like graphics designing and video editing.
Automotive
Previously, we based the Automotive segment on its quarterly Q1 to Q3 revenue growth, which was 33% for the full year. However, its actual growth was lower at 21% only. Therefore, we examine our projections for its automotive segment. We compared the top automotive ADAS chipmakers including Nvidia, Qualcomm, Mobileye, NXP and Texas Instruments.
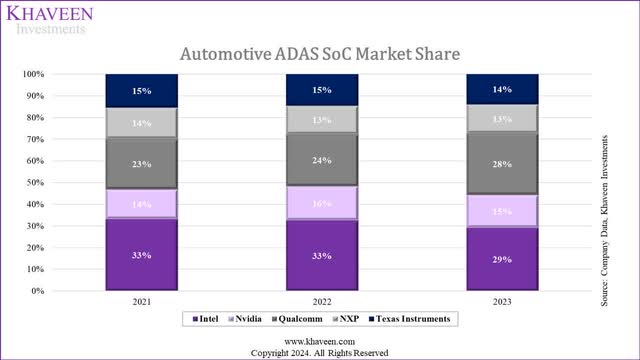
Company Data, Khaveen Investments
As seen above, Qualcomm has had a strong 2023 gaining the most market share as it secured new automotive customer partnerships in 2023 and a product breadth advantage with its Snapdragon Ride platform encompassing Connectivity, Infotainment, Processing and Vision as well as performance advantage due to its advanced ADAS capabilities supported, process technology and high core count.
Furthermore, we derived a competitive factor score calculation based on our rankings of the chipmakers where we ranked Nvidia trailing behind only Qualcomm and NXP in terms of product breadth as Nvidia encompasses Infotainment and Processing and trails behind Qualcomm in terms of performance. This is due to Nvidia having revealed its upcoming DRIVE Thor which is anticipated to be released this year. Furthermore, Nvidia highlighted that it had secured new partnership agreements with cutmarks including “Li Auto, Great Wall Motor, ZEEKR, the premium EV subsidiary of Geely and Jeremy Xiaomi EV,” adopting Nvidia’s new DRIVE technologies.
|
Company Ranking |
Product Breadth |
Performance |
Average Ranking |
Competitive Factor Score |
|
Mobileye (Intel) |
5 |
3 |
4 |
0.8 |
|
Nvidia |
3 |
2 |
2.5 |
1.1 |
|
Qualcomm |
1 |
1 |
1 |
1.5 |
|
NXP |
1 |
5 |
3 |
1.0 |
|
Texas Instruments |
3 |
4 |
3.5 |
0.9 |
Source: Khaveen Investments.
We project Nvidia’s revenue growth based on the ADAS market CAGR of 18.7% but factoring in our calculated factor score as we anticipated Nvidia to gain market share in automotive due to its strong product breadth and performance. As a result, we derived a CAGR forecast of 28% which we believe is more reasonable and sustainable as it is between our previous forecast (33%) and actual growth (21%) in 2023.
Outlook
|
Revenue Projections ($ mln) |
2023 |
2024F |
2025F |
2026F |
|
Gaming |
10,427 |
14,673 |
20,016 |
22,712 |
|
Growth % |
4.8% |
40.7% |
36.4% |
13.5% |
|
Professional Visualization |
1,559 |
1,728 |
1,915 |
2,121 |
|
Growth % |
-17.3% |
10.8% |
10.8% |
10.8% |
|
Data Center |
47,566 |
77,725 |
125,051 |
198,247 |
|
Growth % |
156% |
63.4% |
60.9% |
58.5% |
|
Automotive |
1,093 |
1,317 |
1,588 |
1,915 |
|
Growth % |
33.0% |
20.6% |
20.6% |
20.6% |
|
OEM and Other |
277 |
277 |
277 |
277 |
|
Growth % |
-41.8% |
0.0% |
0.0% |
0.0% |
|
Total |
60,922 |
95,720 |
148,848 |
225,273 |
|
Growth % |
125.9% |
57.1% |
55.5% |
51.3% |
Source: Khaveen Investments.
Overall, we projected the company’s total revenue growth of 57% in 2024, which is lower compared to the total growth of 126% in 2023. The difference in growth is primarily due to the Data Center segment which grew by 156% in 2023 while we forecasted it to grow at a more sustainable rate of 63.4% in 2024, making it still the highest growth segment at a forward average of 60.9% driven by Nvidia’s data center and AI leadership followed by Gaming segments as we anticipate the company’s PC GPU revenue growth to rebound with the recovery in the PC market in 2024. Furthermore, we forecasted its Automotive segment growth at an average of 20.6% as we expect it to gain market share and outperform the market growth with its strengths in product breadth and performance.
Valuation
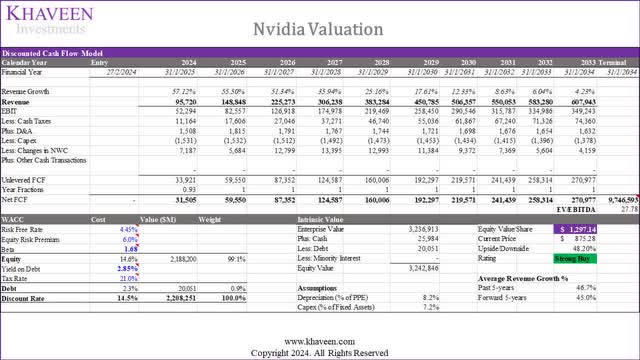
Khaveen Investments
Based on our updated discounted cash flow (“DCF”) valuation with a discount rate of 14.5% (company’s WACC) and terminal value based on a 5-year U.S.-only chipmakers’ average EV/EBITDA of 27.78x, we derived an upside of 48%. Our valuation is higher than our previous analysis, despite a similar forward average growth from 2024 to 2028 (45% vs 42%), mainly due to the higher revenue base in 2023 by $10.3 bln, resulting in a difference in our dollar revenue figures of $383 bln by 2028 compared to $284 bln previously. While this may appear optimistic, according to AMD, it expects the AI chip market to reach $400 bln by 2027, and we expect Nvidia to maintain its solid leadership in the market.
Verdict
Khaveen Investments
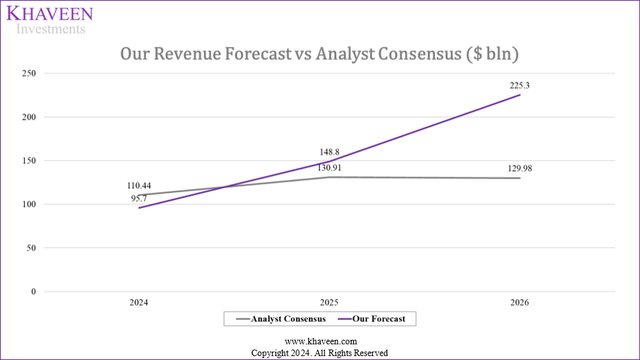
|
Nvidia Revenue Forecasts |
2024 |
2025 |
2026 |
|
Analyst Consensus |
110.44 |
130.91 |
129.98 |
|
Analyst Consensus Growth % |
81.28% |
18.53% |
14.57% |
|
Khaveen Investments Forecast |
95.7 |
148.8 |
225.3 |
|
Khaveen Investments Forecast Growth % |
57.12% |
55.50% |
51.34% |
Source: Khaveen Investments.
Compared to analyst consensus estimates, our revenue forecasts are lower in 2024 but higher in 2025 and 2026 as we maintain more stable growth projections for Nvidia, driven primarily due to its Data Center segment at a forward average of 60.9% underpinned by its AI leadership. While our revenue growth is lower in 2024, it is more consistent beyond 2024 compared to analysts’ consensus estimates. We believe analyst consensus’ low estimates for 2025 and forward are largely influenced by management guidance which it did not provide beyond 2024, resulting in the difference in forecasts in 2025 and 2026. In comparison, our forecasts are derived independently based on individual segment projections and modeling thus we believe reflect a more accurate long-term growth outlook.
In summary, our initial full-year growth forecast for Nvidia in 2023 fell short, as the actual growth reached 126%, surpassing our prediction of 87.6%. The Q4 2023 revenue growth accelerated with a YoY rate of 268%, exceeding both our expectations and the company’s guidance. Particularly, the Data Center segment exhibited the largest disparity, achieving a full-year growth of 217% compared to our forecast of 156%. We believe Nvidia’s leadership in the AI data center space, supported by a comprehensive product portfolio and robust development roadmap, as well as the expansion of the AWS partnership in Q4, covering GPUs, CPUs, and AI software solutions contributed to the outperformance.
Looking ahead, we maintain our positive outlook on Nvidia’s Data Center segment, fueled by extensive partnerships with top cloud providers and the potential for sovereign AI initiatives. The company’s collaborations with government organizations worldwide and the expected growth in data center subsidies could further enhance its position. Despite the exceptional Q4 performance driven by AWS partnerships, our long-term forecast for Data Center growth remains unchanged at an average of 60.9%. We believe this sustained growth is underpinned by Nvidia’s extensive partnerships, product breadth with a clear roadmap and performance advantages.
For 2024, our projections indicate an overall company revenue growth of 58%, with Data Center leading the way, followed by Gaming and Professional Visualization segments. Anticipating a rebound in PC market conditions, we expect the PC GPU revenue to recover. Additionally, we project the Automotive segment to achieve an average growth of 20.6%, driven by market share gains and strong product performance.
Overall, we maintain a Strong Buy rating for Nvidia stock, raising our price target to $1,297.14. Although our projected forward average growth from 2024 to 2028 remains similar (45% compared to 42%), our valuation has increased. This adjustment is primarily attributed to a higher revenue base in 2023, with an additional $10.3 bln and higher EV/EBITDA U.S.-only chipmakers’ industry average (27.78x vs 23.38x).
Read the full article here