Different asset classes and investment vehicles have different distribution policies, with different implications for investors. I’ll be going through some of these in this article and a quick summary follows.
ETFs tend to distribute any and all income generated to investors, and nothing else. As such, ETF distributions tend to be fully covered by the underlying generation of income and are indicative of the same. Income is sometimes lumpy, as are ETF distributions.
CEF distributions tend to be managed, or set, by their investment management team. This generally results in shareholder-friendly, stable, monthly distributions. Some distributions are set in unsustainable ways, however.
Equity distributions are set by a corporation’s management team, and they have a lot of leeway in doing so. Distribution sustainability is an important factor to consider.
Bond distributions are well-defined contractual, legal, obligations. These make them much more reliable than average, and somewhat amenable to analysis and forecasts. T-bills were always going to yield more as the Fed hiked rates, as were T-bill ETFs.
For simplicity’s sake, I’ll be referring to all distributions as, well, distributions in this article. Some of these are dividends, some might be coupon or interest rate payments, but settled on distributions for all, for simplicity’s sake.
ETF Distributions – Income Distributions
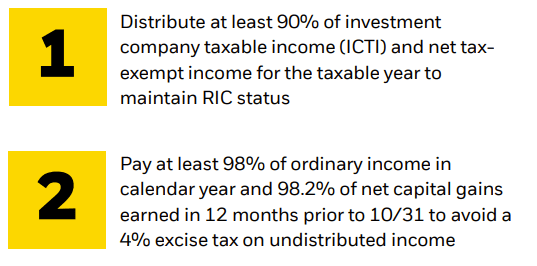
ETFs are almost always structured as Regulated Investment Companies, or RICs, which are subject to certain distribution requirements. RICs must, at least, distribute almost all income received and realized capital gains to investors. BlackRock summarizes the situation thus:
BlackRock
In practice, almost all ETFs distribute any and all income received to investors, to comply with applicable regulations. On the other hand, capital gains distributions are exceedingly rare, as ETF transactions are generally conducted in-kind, which are not taxable events so capital gains are not realized.
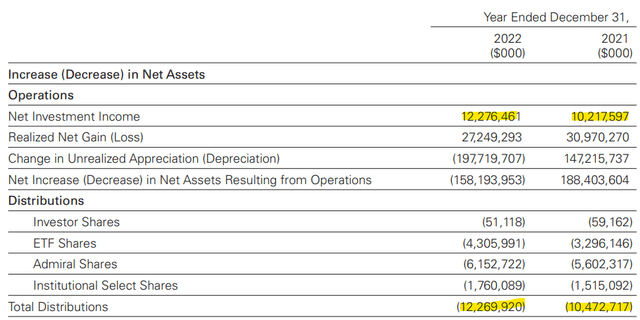
As an example, Vanguard S&P 500 ETF (VOO) distributions tend to (roughly) equal fund net investment income. Capital gains, meanwhile, have almost no impact on fund distributions.
VOO
Implications
Distributions Roughly Equal Income
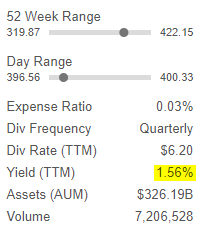
As ETF distributions generally consist of income only, and as ETFs generally distribute all income generated, ETF distributions are generally roughly equivalent to the underlying generation of income. As an example, VOO sports a 1.56% dividend yield, which means that the fund generated around 1.56% in income last year:
VOO
Due to the above, in most cases, investors can simply look at an ETF’s yield to ascertain its income, without worrying too much about other factors. ETF investors rarely have to worry about ROC distributions, special distributions, and issues of that nature. ETF distributions are generally fully covered by the underlying generation of income as well.
At the same time, in most cases, investors can forecast an ETF’s dividend growth based on expected underlying income growth. As an example, almost all bond ETFs have seen strong dividend growth since early 2022, when the Federal Reserve started to hike rates.
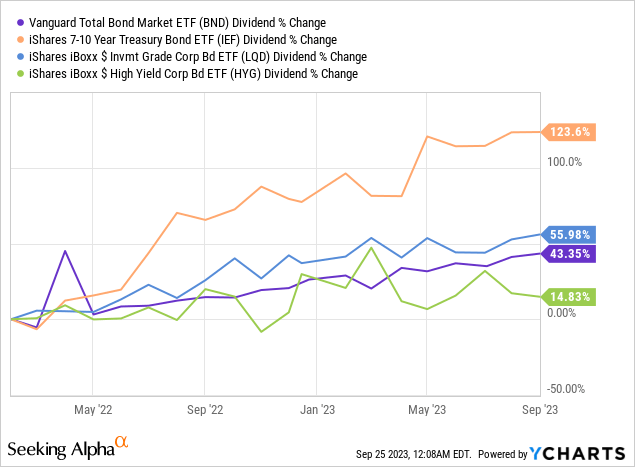
Higher Fed rates meant higher bond rates, which led to higher bond ETF income, which resulted in higher bond ETF distributions. Remember, ETFs are required to hike their distributions in cases like these, so distribution growth was easy to forecast.
Distribution Volatility
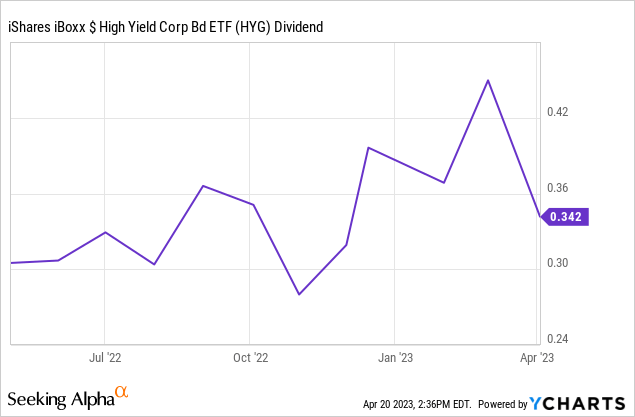
As ETF distributions are bound by regulation, these might not necessarily behave in desirable ways. Distribution volatility is common, as are distribution cuts. Stability is rare, with most ETFs making no effort to ensure consistent or smooth distributions quarter to quarter. As an example, a quick look at the distributions of the iShares iBoxx $ High Yield Corporate Bond ETF (HYG), the largest fund in its segment.
Data by YCharts
As can be seen above, HYG’s distributions fluctuate month to month. This is quite common for ETFs, most of which concentrate on complying with applicable distribution requirements, and pay no mind to distribution stability.
Exceptions
ETF Exceptions
Some ETFs pursue managed distribution policies, in which distributions are set by the fund’s management team. For these ETFs, the implications above might not necessarily apply.
Some examples of ETFs with managed distribution policies are the Strategy Shares Nasdaq 7 Handl™ Index ETF (HNDL), which targets a 7.0% distribution yield on NAV, and some of the Global X covered call ETFs, which cap their distributions at 12.0%. For the latter, the implications still somewhat apply, at least below the cap.
ETFs with managed distributions are uncommon.
Income Exceptions
Some sources of income (or returns) are not classified as accounting income, with implications for shareholders.
MLP distributions are not classified as income, so ETFs with significant investments in MLPs might not generate significant accounting income. ETFs with investments in MLPs still generally distribute this income to shareholders, however. Due to this, MLP ETFs tend to have significant ROC or capital gains distributions. This is mostly an accounting issue, and so investors can generally assume that MLP ETF distributions are backed by underlying generation of income (MLP distributions).
Option premiums are also not classified as income either, with similar implications to the above. Most option ETFs distribute option premiums to shareholders too, with similar implications as well. Option premiums vary, which means option ETF distributions might not necessarily be stable or sustainable. Analyzing these issues on a fund or strategy basis is important.
Capital Gains Exceptions
ETFs are generally able to avoid realizing capital gains, by transacting in-kind. This is difficult, sometimes impossible, to do for some niche asset classes, including some commodity futures, options, and assorted derivatives. Due to this, ETFs investing in these securities sometimes distribute excess capital gains/returns to shareholders.
As an example, the Invesco Optimum Yield Diversified Commodity Strategy No K-1 (PDBC), which holds commodities futures, generally distributes profits from its commodity positions at the end of the year. These can be massive, with the fund distributing around $7 per share to investors in late 2021, roughly equivalent to a 30% yield. PDBC’s distribution was massive, as the profits from its commodity futures positions were massive too.

Seeking Alpha
As an aside, although it might seem that there are a lot of exceptions to ‘normal’ ETF distributions, these apply to a relatively small number of ETFs. The average equity or bond ETF simply distributes its income to shareholders, nothing more, nothing else. The more common exceptions, including MLPs and covered call funds, in practice behave the same way.
CEF Distributions – Managed Distributions
CEFs are almost always structured as Regulated Investment Companies, or RICs, and must meet similar distribution requirement to ETFs. So, CEFs must distribute at least almost all of its income and realized capital gains to shareholders.
In practice, most CEFs have managed distribution policies, in which the fund’s managers set a fixed monthly distribution, to ensure distribution stability for shareholders, while complying with applicable regulations at the same time.
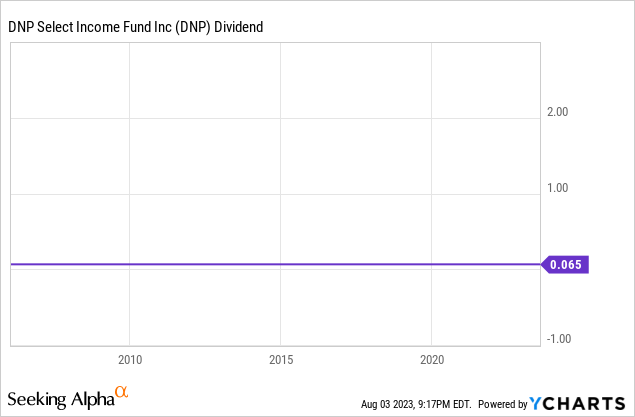
As an example, the DNP Select Income Fund (DNP) has paid the same $0.065 monthly distribution since mid-1997, although there have been a couple of special distributions since:
Data by YCharts
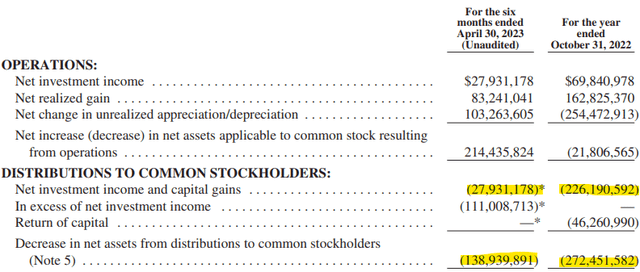
DNP’s distributions comply with applicable regulations, as these are higher than the fund’s net investment income and capital gains (remember, the rules say at least):
DNP
Implications
Investor Preferences and Distribution Stability
CEF-managed distribution policies tend to be tailored to investor needs and preferences, a self-evident benefit for investors.
Distributions tend to be stable, which makes retirement planning easier. Distributions tend to be monthly, with the same benefit. CEFs are loathe to cut their distributions, so cuts are rare.
For the average retiree, the average CEF is likely to provide preferable distributions compared to the average ETF. There are many exceptions, and this is ultimately dependent on the preferences of each individual investor.
Unsustainable Distributions
CEFs sometimes have unsustainable distributions, for two reasons.
First, most CEF investors desire high yields, most CEFs deliver, some go overboard.
Second, as CEFs must distribute at least almost all of their income to shareholders, distributions can only ever feasibly be higher than income.
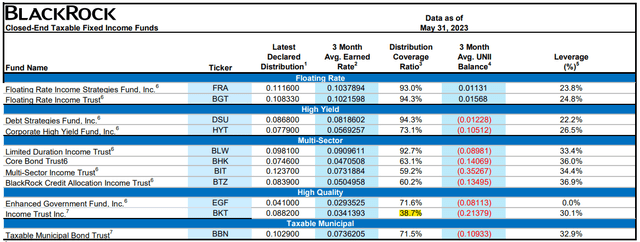
Due to the above, most CEFs have distribution coverage ratios below 100%, some much lower. As an example, we have BlackRock fixed income CEFs:
BlackRock
As can be seen above, all BlackRock CEFs have distribution coverage ratios below 100%. One, the BlackRock Income Trust (BKT), has a coverage ratio of only 38.7%, indicative of an unsustainable distribution.
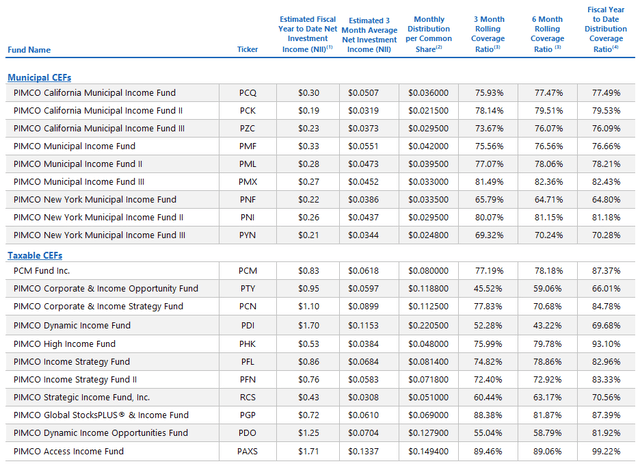
Figures for some of the PIMCO CEFs are quite similar, all have distribution coverage ratios below 100%, some below 60%:
PIMCO
Due to the above, CEF investors should always analyze a fund’s distribution sustainability before making an investment decision. Looking at distribution coverage ratios is one way of doing so. I’m more partial to looking at NAVs since inception, as unsustainable distributions tend to lead to declining NAVs.
Corollary of the above is that distribution growth is a bit harder to forecast. All else equal, income growth should mean distribution growth, but perhaps it simply results in a higher distribution coverage ratio.
Uninformative Distributions
In my opinion, and I’m sure some readers will disagree, the above means that CEF distributions are not necessarily informative metrics. High CEF distributions could mean strong underlying generation of income, or they could mean an irresponsible management team, or a future distribution cut (and the losses that entails). ETF distributions tend to be much more informative metrics, however.
Overall Implication
In my opinion, CEF distributions are closer to what investors want, but can also be misleading. Invest with care.
Equity Distributions – Management Distributions
Equity distributions tend to be set by the corporation’s management team. Corporations tend to take into consideration company earnings, financials, and investor preferences when setting their distributions. Corporations have a lot of leeway. Practices vary.
The best corporations ensure long-term distribution sustainability and growth, without hampering company growth prospects or financials.
The worst corporations have unsustainable distributions, cut them, and investors lose their shirt.
Most have reasonably sustainable distributions, with some growth.
In my opinion, and considering the above, investors must make sure to gauge a corporation’s distribution sustainability, through an analysis of its earnings, balance sheet, and distribution track record.
Bond Distributions – Coupon Rates and Contractual Obligations
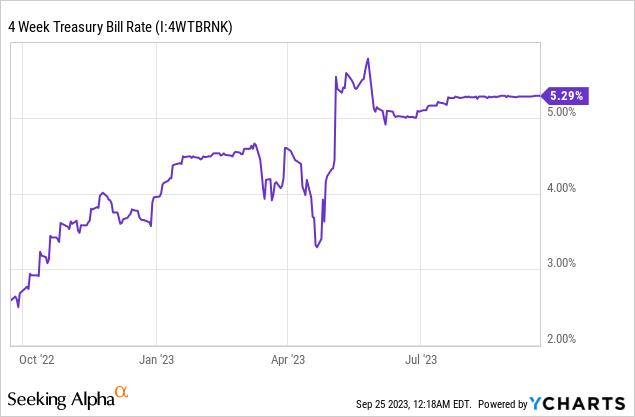
Bond distributions are well-defined contractual, legal, obligations which institutions must comply with. Investors in a t-bill yielding 5.29% will receive 5.29% in interest, or its annualized equivalent, barring an unprecedented U.S. government default:
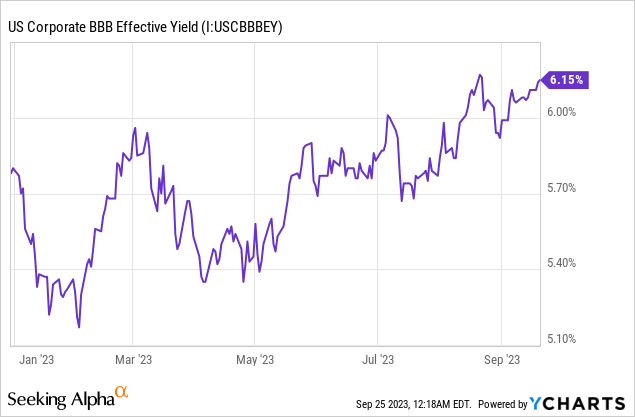
Investors in a BBB-rated corporate bond yielding 6.15% will receive 6.15% in interest, barring a corporate default (which do sometimes happen):
The fact that bond distributions are contractual, legal, obligations constrain them in important ways. Corporations have very little ability to cut their bond distributions, at least unilaterally. Cancelling a bond distribution outright means a default, which will very likely lead to a bankruptcy filing. Corporations have very little reason to increase their bond distributions as well. Do bear in mind that the situation is very different for corporate dividends, as companies are rarely required to make these. The greater reliability of bond distributions might be of particular importance to retirees and risk-averse investors.
The fact that bond distributions are well-defined means that these are amenable to analysis and forecasts. As an example, t-bill yields will almost certainly decline when the Federal Reserve starts to cut rates, which might occur next year. Bond funds have seen strong distribution growth since early 2022, when the Federal Reserve started to hike. Treasury inflation-protected securities would see higher yields if inflation increases.
On a more general note, equity and bond distributions are different, and it is important for investors to be aware of these differences when analyzing or comparing their distributions.
As an example, a corporation slashing its dividend could indicate severe financial weakness, and presage a drop in earnings and attendant shareholder losses. Lower t-bill yields would simply be the result of Federal Reserve policy, and would not indicate weakness in the federal government’s finances.
As another example, the fact that long-term t-bill returns are quite low has little bearing on their short-term expected returns, as t-bill yields were much lower in the past. The fact that long-term AT&T (T) returns are quite low, however, might very well indicate a sub-par investment, due to destructive capital allocation, low growth, etc.
Conclusion
Different asset classes and investment vehicles have different distribution policies, with different implications for investors. I’ve covered some of the main characteristics and implications of ETF, CEF, equity, and bond distributions. Hopefully, the information here was of use and interest to investors.
Read the full article here


Leave a Reply