The S&P 500 has declined about 9.5% since I last published the Equity Market PROs and CONs report on July 28th. At the end of July, investors were flying high as the major indices had put in an impressive rally. When August began the S&P was up 19+%. In that report, I noted the CONs slightly outweighed the PROs 13-12.
We closed out another losing month in September and set sail into Q4, and now we’ll revisit the PROs and CONS that are on the scene today. In this report, the Negatives outweigh the Positives 12-8 – with 2 issues that I consider Neutral.
Pros
1.) Bull Market
The last two months of trading in the market have been difficult for the BULLS. The major averages peaked in late July/early August and have been trending lower ever since. The Russell 2000, which has been the weakest of the three major indices since the 2022 lows, broke down even further and by my work is in its’ own BEAR market. Admittedly it takes a positive view of the entire situation to place this in the PRO column. At best it’s a VERY selective BULL market backdrop and that is where I plan to concentrate my efforts in Q4.
2.) Bearish Sentiment
Investor sentiment took forever to turn bullish this year. ironically it turned earlier this summer just in time for equities to peak and pull back in August and September. This typical contrarian indicator worked again. Now, it’s back to bearish for investors. The Bespoke Investor Sentiment Composite is negative once again and CNN’s Fear & Greed Index is registering “Fear” right now. Since the sentiment is contrarian, excess bearishness is considered Bullish.
3.) Q4 Seasonality
Seasonality was a ‘Con’ in my last PROs and CONs report, and unfortunately for the BULLS, it didn’t disappoint. August and September weakness for equities held to form this year, but now seasonality moves back into the ‘PRO’ column as Q4 is typically the best time of year for stocks. As shown below in the snapshot from the Bespoke Seasonality Tool, the upcoming 3-month period has been the very best 3-month period of the year for stocks over the last ten years.
Seasonality (www.bespokepremium.com)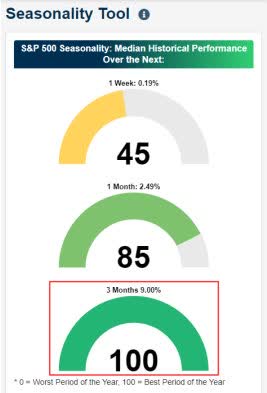
The 100th percentile for gains is certainly bullish.
4.) Peak Inflation
Core inflation has come down and is showing signs of stability. Supercore inflation is deflating slower but still making progress. While inflation isn’t DEAD, the stock market by its price action after the last report believes the peak is definitely in and is ready to deal with current readings for a while longer.
5.) Jobs Steady
Initial jobless claims have steadied while employment growth has slowed. Prime-age employment remains just shy of a record-high share of the population. While job openings have declined (indicating weaker labor demand), the level remains very high compared to historical readings.
6.) Healthy Consumer
Consumers still have lots of cash on their balance sheets, even relative to much stronger consumer spending relative to pre-pandemic. While savings rates are low, consumer borrowing is well-covered by income and households can keep spending at a healthy (if slowly moderating) pace for some time. When consumers have jobs they will continue to spend. In addition, Corporations are not about to give up the employees they had a hard time acquiring after the pandemic. That keeps the labor situation “tight”.
7.) Infrastructure Spend
A range of manufacturing industries are rapidly adding factory capacity in response to recent industrial policy (CHIPS, BIL, IRA). Construction on factories is running north of $200bn per year with hundreds of billions more in spending to come. At the same time, the housing market is still short of inventory and will be for years to come. Finally, infrastructure spending has accelerated sharply thanks to fiscal policy and is not showing any signs of slowing down. It’s a double-edged sword. Good news for select sectors of the economy but it also keeps “Debt” and “Inflation” elevated.
8.) Earnings Estimates
During the 2022 bear market, rolling 12-month forward earnings estimates fell 6.5% from peak to trough. Since then, they have recovered almost the entire decline. Of course, analysts tend to lag the market, and estimates only started getting cut well after the 2022 bear market was underway. Still, underlying earnings are in good shape. Recent results have also started to turn more positive. The EPS beat rate fell from its historic post-COVID surge, but over the last few months has ramped back up again. A similar, more modest recovery in guidance raise rates is also taking place.
9.) AI Boom
The equity market thrives on “themes”, and “AI” has been the market’s theme in a big way for most of this year. There’s a good chance this becomes a secular rather than cyclical wave. Over the long term that is bullish for equities. Every week there seems to be some new technology in the AI space introduced, and search interest for AI topics remains elevated and trending higher.
The only question is when will real money hit the bottom line.
Cons
1.) Market Breadth
Outside of the mega-caps in the S&P 500, it has been a flat year for the market. So even though the cap-weighted S&P 500 is still showing a 10%+ YTD gain, things aren’t nearly as rosy underneath the surface. The median S&P 500 stock is flat, while the median stock in the small-cap Russell 2000 is solidly in the red at -7%. That doesn’t look like the “new” BULL market backdrop that the majority says it is. As the week ended I now see ALL of the indices barely above their Long term trendlines. This equity “market ” is living on the edge.
2.) Yield Curve
Main Street media always talk about the 2-year/10-year Treasury Yield curve. The Fed also watches another metric. The 3-month/10-year Treasury yield curve has now been inverted for a record 222 consecutive trading days. The curve reached its maximum point of inversion in early May at 183 basis points and has steepened to its current level of -75. Given that it has been nearly a year since the curve first inverted and the economy still appears to be steady, there’s a growing consensus that the current signal has been a false alarm.
But don’t dismiss the yield curve too quickly. As shown in the table below, historically, the average number of days between when the yield curve first inverts to the start of a recession is 589 days.
Yield curve (www.bespokepremium.com)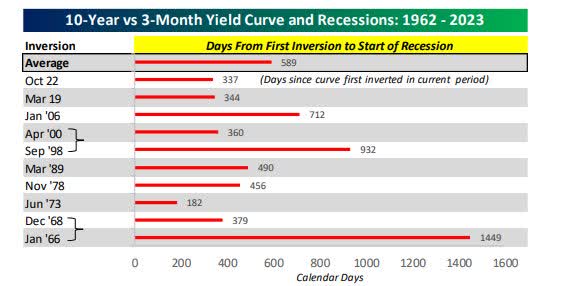
From the time the yield curve bottoms to the start of a recession, the average is 395 days. Based on these two figures, a recession in the second half of 2024 would fit right within the averages.
3.) Leading Indicators
The Leading Economic Indicators index published by the Conference Board takes a range of different economic and financial market data points into account and creates a single index that tends to deteriorate before recessions and recover before activity bottoms. As shown in the chart, the pace of decline for leading indicators this fast has always meant a recession. In other words, if we don’t see a recession following this run of data, it will be an unprecedented result.
LEI (www.bespokepremium.com)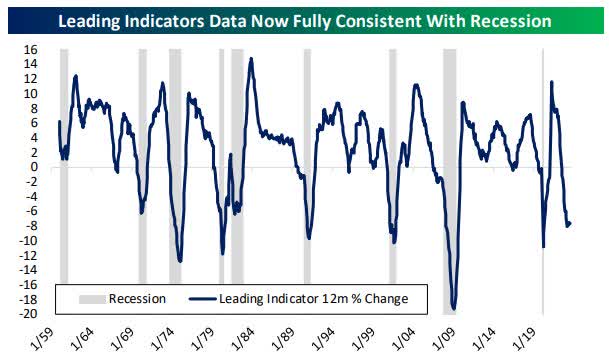
The Leading Indicators have fallen for 18 consecutive months. Only two other periods have seen longer streaks of decline: the mid-1970s recession and the global financial crisis.
4.) Policy Rate Isn’t Restrictive
There is a consensus view that the FOMC is near its terminal rate or close to it. However, the message we heard this week from Chair Powell is NOTHING new. It’s HIGHER for longer and investors better start believing that the longer part is going to be VERY long. Yet I hear analysts continue to forecast rate cuts next year. The dilemma the equity market is facing is twofold. Higher for Longer is scary and IF rates are indeed cut – then that means the economy is falling off a cliff. That too is pretty scary. The Fed is in a box and along with the market is facing a lose-lose situation.
5.) Affordability
Home prices have surged thanks to a mismatch between supply and demand. High mortgage rates mean existing homeowners are unwilling to surrender extremely low rates, further restricting supply.
Those high mortgage rates also damage affordability driven by high prices. When combined, affordability has hit the worst levels since the 1980s, with the average non-managerial worker needing to pay the equivalent of 86.7 hours of wages to cover the mortgage payment for the median existing home assuming 5% down. And down payments are increasingly difficult to save up given high prices.
6.) Tighter Lending
The shock to the banking system delivered late last year and early this year has largely been digested by the market. However, leading indicators of bank credit suggest a sharp slowdown in the growth of bank lending over the next year.
The SLOOS (Senior Loan Officer Outlook Survey) asks lenders whether they are seeing higher or lower demand for credit, as well as whether they are raising or lowering the standards they underwrite to. As shown in the chart below, the reported demand for credit and the reported credit standards suggest that commercial & industrial (C&I) loan growth is set to slow dramatically.
Loan Demand (www.bespokepremium.com)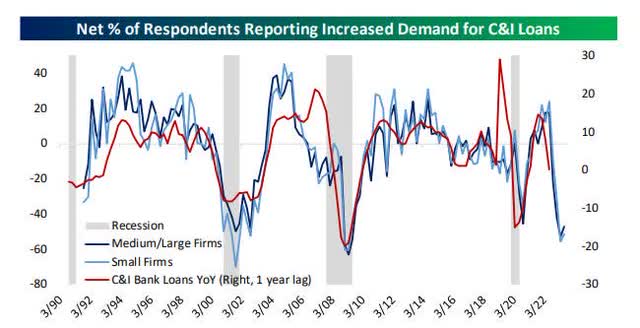
Declining credit outstanding would only do bad things for the economic backdrop.
7.) Geopolitical Events
The terrorist attack in Israel highlights another U.S. policy error. From a financial point of view that brings the country into another conflict. The US “debt” issue was highlighted in last week’s MACRO update. It appears the US is now supporting two wars. Ukraine, and now Israel along with the continuing overhang of the China/Taiwan situation come at a time when the U.S. finds itself in the weakest fiscal situation since WWII. This country has never been more stretched and vulnerable, and at some point, this will have a serious impact on the MACRO economic scene. At some point, the market sniffs this MACRO issue as the serious threat that it is.
8.) Valuations
Two years ago, we could look at an S&P 500 P/E ratio in the high teens, or even 20, and say that at least interest rates were low. That isn’t the case anymore.
Bespoke Investment group; On a trailing basis, the S&P 500 trades for 20.6 times earnings, and while that is far from a record, it ranks in the 83rd percentile relative to all other readings in the post-WWII era. Comparing the earnings yield of the S&P 500 (inverse of the P/E ratio) to the yield on the 10-year US Treasury, the current spread of 0.25 percentage points is the lowest since 2010.
While ‘the market’ is expensive, the key driver of the valuation stems from the largest stocks in the index. As shown below, the 10-largest stocks in the index, which account for 32% of the S&P 500, trade for a median of 31.7 times earnings with four stocks trading for over 65 times earnings.
Large Caps (www.bespokepemium.com)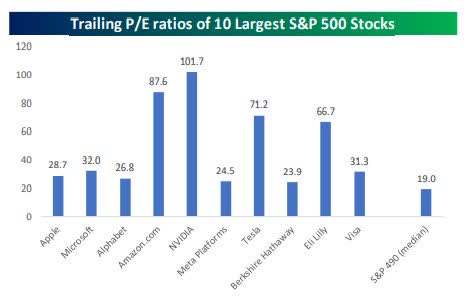
Meanwhile, the median multiple of the remaining 490 stocks is ~20 times trailing earnings. That was OK when interest rates were zero, but at 5+% we are in a different backdrop that typically takes PE ratios down.
9.) TARA (There Are Reasonable Alternatives)
This “CON” has been on the list since the beginning of the year, yet stocks have risen. As mentioned earlier, the S&P 500’s earnings yield relative to Treasury yields and real rates is at its lowest levels in decades, meaning stocks are less attractive relative to risk-free rates. The S&P 500’s dividend yield was more than 100 basis points higher than the 2-year Treasury yield two years ago, but it’s now ~350 basis points lower. There is an alternative to stocks again. As uncertainty ramps higher, investors will reach for risk-free yield. All of that cash that many analysts and BULLS say is on the sidelines and will go into stocks, seems more like a “Hope” trade. Those analysts are living in the past.
10.) Inflation Base Effects
While inflation readings have come down dramatically over the last year, the June Year over-year reading of 2.9% might be as good as it gets in the near term. Huge month-over-month increases in CPI in early 2022 are now removed from the y/y CPI tally, which will make it harder for CPI to continue lower in the coming months unless we see outright deflation which is not currently projected. Investors expecting the y/y CPI number to continue lower may be surprised to see it keep ticking higher up towards 3.5%-4%+ through year-end and beyond. The latest PCE report confirms that inflation is still hanging on, and any further progress will be SLOW.
11.) Dollar Surge
From the October 2022 peak through the July 14th bottom, the broad trade-weighted dollar fell 8.4%. Over the last three months, it has risen close to 4%. Since 1973, larger-than-typical dollar rallies have led to lower-than-typical S&P 500 returns. As long as the dollar is strong, it’s doubtful the stock market will take off in a big way. Of course, the inverse statement is also true: a reversal lower in the dollar would set up a positive backdrop.
12.) Lower Highs
The bull market’s uptrend from the October 2022 low has been celebrated, but as I have continually pointed out the near-term technicals do not look good. They still have a lot to prove before I can BUY into the New BULL market scene.
We’ve seen a series of lower highs and lower lows since the market made its high for the year on the last day of July. For this negative technical action to turn, we’ll need indices to break above their early September highs
Indices (www.bespokepremium.com)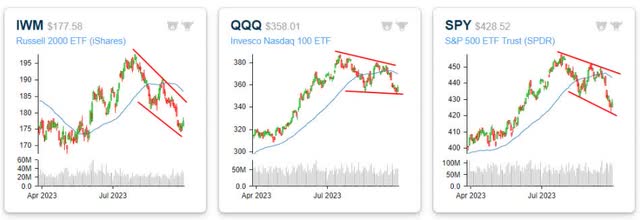
Neutral (Could go either way)
1.) Manufacturing Bottoming
The results of all five of the regional Federal Reserve manufacturing surveys for September were released. Altogether, regional Fed surveys have shown that manufacturing activity improved slightly in September. The PRO crowd will claim that we have seen the bottom and improvement is on its way.
The folks that present the Bearish argument say “Show me”. They point out that after two years of declines, the net readings are still in contraction territory. I lean to the CON side on this one.
2.) Asset Class Extremes
The fact that stocks hit such extreme oversold levels towards the end of September – a notoriously weak time of year for stocks – is a ‘PRO’ in the minds of an optimist, as there is a tendency for prices to revert when they get this overdone.
Furthermore, Treasury yields, the dollar, and oil are all at extremes to the upside at the same time. It doesn’t take much for a big reversal to occur when things get this one-sided. That is true BUT “extreme” conditions can last for longer than an investor wants to believe. “Hoping” for a change in direction is a bad strategy.
Summary
This time around there are some distinct changes on the list. In July the standout on the PRO side was the trend reversal resulting in a BULL market backdrop that I said trumped just about all of the negatives. This time around we see that has changed again as many indices and the DJIA along with the Russell 2000 are back in a BEAR backdrop.
On the CON side, the T.A.R.A. argument is still there and it has started to impact the market, especially when uncertainty ramps up. There is plenty of cash on the sidelines, but probabilities suggest a lot of that cash won’t make it into equities due to the “risk-free” alternatives. This is one of the reasons I do not see another rip-roaring BULL market leg to new all-time highs on the horizon. The market is going to have to prove and show me that these risk-free alternatives aren’t a factor.
The Earnings forecast is the one issue to watch, and it’s the biggest add to the PRO side of the equation. It is a fluid situation that can change quickly. At the end of the day that will control what happens in the very near term. After I put the report together, I came away with the feeling that the PROs are centered around the near-term prospects, while many of the CONs speak to the MACRO view.
The market is sending a VERY distinct message to investors now. It is time to pay attention.
The Week On Wall Street
Last week’s selling pressure bled over to Monday’s “open” with the S&P establishing a new intraday low during this “correction”. However, buyers emerged and the S&P rebounded to post a modest seven-point loss. The price action was typical for a market that is trying to find a bottom. Intraday rallies dissipate, and there is plenty of choppy price action. The NASDAQ snapped a 4-day losing streak with a modest gain. No such luck for the other indices. The S&P extended its daily losing streak to 5, with the DJIA and Russell 2000 establishing 4 straight days of losses.
More choppy trading on Tuesday was eventually resolved to the upside, something we haven’t seen in a while. All major indices and every sector posted gains for the day as investors celebrated another “Turnaround Tuesday”.
The party ended there for the BULLS. The combined losses for the S&P 500 in the last 3 days of trading tallied 3%. While the NASDAQ Composite fell 3.9%. Support levels were taken out, and the entire market ended the week in an extremely oversold condition.
The Economy
PMI DATA
US companies signaled a marginal expansion in business activity during October, following broadly stagnant output seen in August and September.
PMI Composite Output Index at 51.0 (September: 50.2). 3-month high. Services Business Activity Index at 50.9 (September: 50.1). 3-month high. Manufacturing Output Index at 51.1 (September: 50.8). 6-month high. Manufacturing PMI at 50.0 (September: 49.8). 6-month high
INFLATION
Personal income rose 0.3% and spending increased 0.7% in September, with the latter stronger than forecast. Income has been on the rise since February 2022, and in 23 of the last 24 months. Spending has increased for 6 straight months and in 12 of the last 14 months. Wages and salaries were up 0.4% from the prior 0.5%. The savings rate dropped to 3.4% from 4.0%. and ties December for the smallest since November. And the rate is down from the relative peak of 5.3% in May.
The PCE deflator (Fed’s Key Inflation metric) was up 0.4% for a second straight month and is the fastest since January. The core rate advanced 0.3% from 0.1% previously and the 0.30% two-decimal point gain is the fastest since April. The 12-month headline clip was steady at 3.4% y/y for a third straight month. The core was slowed to 3.7% y/y following the slowdown to 3.8% in the prior month.
Nothing has changed. the fight against inflation has produced results, but further progress will continue to be SLOW.
HOUSING
New home sales surged 12.3% to a 759k pace in September, well above forecast. This follows the 8.2% drop to 676k in August. This is the fastest pace since the 773k pace in February 2022. Gains were registered across all four regions. The supply of homes declined to 6.9 months after jumping to 7.7 in August. The median sales price fell 3.3% to $418,800 after sliding to $433,100 in the prior month.
CONSUMER
Sentiment edged up to 63.8 in the final October print versus the 63.0 preliminary reading. However, the index is down from September’s 67.9 and is the weakest since May’s 59.2. It is a third consecutive monthly drop from already depressed levels. (Pre-pandemic sentiment reports were nearly double what they are today). Both components declined but were led by the expectations index which fell to 59.3 from September’s 65.8. The current conditions index slid to 70.6 versus 71.1 in the previous month.
While the “cheerleaders” raise their Pom-poms, consumers are saying there is little to celebrate in this economy.
The Global Scene
Business activity decreased again across the UK private sector economy during October.
PMI Composite Output Index at 48.6 (Sep: 48.5). 2-month high.
Services PMI Business Activity Index at 49.2 (Sep: 49.3). 9-month low. Manufacturing Output Index at 45.3 (Sep: 44.6). 3-month high.
Manufacturing PMI at 45.2 (Sep: 44.3). 3-month high.
UK PMI (www.pmi.spglobal.com/Public/Release/PressReleases)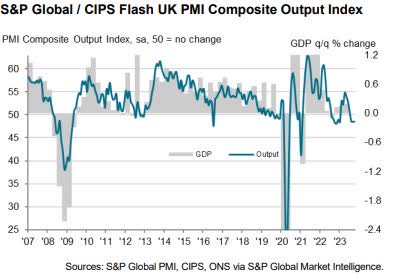
The Eurozone economic downturn accelerated at the start of the fourth quarter
Composite PMI Output Index at 46.5 (September: 47.2). 35-month low.
Services PMI Business Activity Index at 47.8 (September: 48.7). 32-month low.
Manufacturing PMI Output Index at 43.1 (September: 43.1). Unchanged rate of decline.
Eurozone Manufacturing PMI at 43.0 (September: 43.4). 3-month low.
EU PMI (www.pmi.spglobal.com/Public/Release/PressReleases)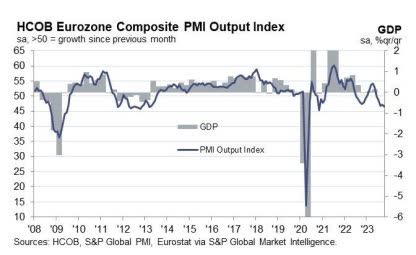
Japan – Private sector activity stagnates
Composite Output Index, October: 49.9 (September Final: 52.1)
Services Business Activity Index, October: 51.1 (September Final: 53.8)
Manufacturing Output Index, October: 47.6 (September Final: 48.7)
Japan PMI (www.pmi.spglobal.com/Public/Release/PressReleases)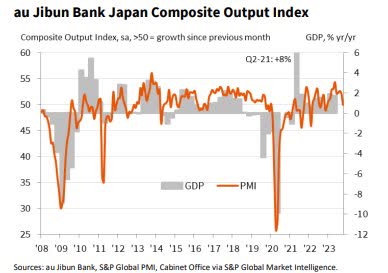
Political Scene
After 22 days without a “speaker,” the House elected Mike Johnson (LA) as their new “Speaker of the House”. Since Mr Johnson is working with the same slim majority, it is doubtful there will be any change in the path that former speaker McCarthy was traveling.
Food For Thought
ENERGY
The administration seems desperate to find more oil supply elsewhere. Iran’s sponsorship of Hamas means a breakthrough in energy with Tehran is unlikely, but a different OPEC member may see an easing of US sanctions. This week, the White House signaled that certain sanctions will be lifted from Venezuela’s oil industry. That decision was based “promise” of freer elections in a dictatorship regime.
However, the fundamental problem with Venezuela’s oil industry-whose production has fallen to a level lower than that of the UK-is not pressure from sanctions. Rather, the issue is that many skilled workers of the national oil company have fled the country amid record-setting inflation and political chaos. Likewise, following the past decade’s nationalization/confiscation of energy assets owned by some international companies, it is difficult to imagine them wanting to return.
Therefore, it is doubtful that any “supply” from this dictatorship will have any impact on the global energy scene. Given this action, it appears that the revitalization of any discussion on “energy independence” in the U.S. is doubtful.
My advice has not changed — Stay with the “Energy” trade.
ESG
Jamie Dimon had some interesting observations on what the globe is facing and ESG didn’t make the top of his list
“I hear people talking about ESG all the time, referring to the environmental, social and governance concerns and mandates for governments and companies.
“I just would put on your table the most serious thing facing mankind is nuclear proliferation. If we’re not sitting here 100 years from now, it will be nuclear proliferation. It’s not our climate.”
Recent events have once again highlighted the situation in IRAN. Perhaps it is time for someone, anyone who controls policy in this world to sit up and take notice.
Investment Backdrop
- All of the major indices are at “critical” levels. It’s make-or-break time.
- Semiconductors are viewed as “leading” indicators for the broader market and they will need to step up and ignite a rally.
- Oil, Gold, Silver, and Uranium are still in rally mode.
- Strategies often do not work out “perfectly”, and this time is no different. The Q4 rally may eventually come, but as I’ve stated all along – “From What Level”
I assess, re-evaluate, and assess again. My Q4 re-evaluation is published and that report is available to members of my services.
The Daily chart of the S&P 500 (SPY)
The S&P 500 has lost ground in eight out of the last nine trading days, and ten out of the last 12, as a selling stampede has gripped the equity market. Many analysts had the 4200 level as their line in the sand. When that went by the wayside in this week’s selloff, the selling picked up.
S&P 500 (www.tc2000.com)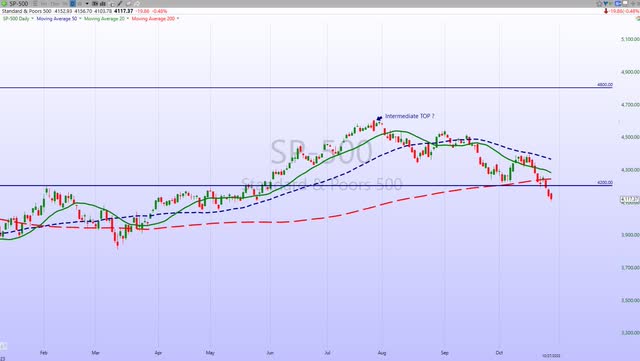
No one knows when the selling will abate but the door to S&P 4000 has now opened. This is not the type of market to wander aimlessly by “hoping” and “guessing” what to do next. Investors without a plan are now finding out just how difficult this backdrop is.
Final Thoughts
This “dip” has now morphed into a “correction” for the NASDAQ (-12%), while the S&P has now joined in with a 10+% decline. The Russell 2000 small caps have been in their own BEAR market for a while.
In a recent 5-day period investors witnessed Crude oil rally 9+%. 10-year Treasury yields have been on a one-way move for what seems like forever now. In that same period, the 10-year Treasury yield rose 29 basis points and settled right near 5%
Finally, Gold. In the same five trading days, the metal rallied 5.5% breaking above two key resistance levels and the downtrend that has been in place since the Spring.
By themselves, these moves are big, but the fact that they’ve all occurred in the same five-day period is extraordinary. Bespoke Investment Group;
There have only been two other periods where gold and crude oil each rallied more than 5% while the 10-year yield jumped more than 25 basis points. The first was in August 1990 following Iraq’s invasion of Kuwait which led up to the first Gulf War, while the second period was during the Financial Crisis when there were three separate occurrences (September 2008, January 2009, and March 2009).
I’ll leave everyone with this;
“There’s something happening here, but what it is ain’t exactly clear.” Buffalo Springfield
THANKS to all of the readers that contribute to this forum to make these articles a better experience for everyone.
Best of Luck to Everyone!
Read the full article here





Leave a Reply