Investment Thesis
Mid-America Apartment Communities (NYSE:MAA) is the largest and arguably strongest Sunbelt apartment REIT with about 102,000 units in the portfolio. This portfolio is well diversified across various types of multifamily communities, including highly amenitized and luxurious apartments appealing to higher income individuals as well as more modest and affordable units acting as workforce housing.
It also boasts the best-positioned balance sheet in its peer group with investment grade credit ratings of A3/A-, net debt to EBITDA of 3.4x, a weighted average interest rate of 3.4%, and a weighted average debt maturity of 7.5 years.
Beyond discernible traits of quality in the portfolio and balance sheet, there’s often a certain je ne sais quoi about high-quality companies that’s difficult to pinpoint. You just know it when you see it, assuming you have an adequately trained eye.
If I had to put it in a word, what makes MAA so appealing for long-term dividend growth investors such as myself is its conservatism – with debt, portfolio growth, investment underwriting, equity issuance, dividend coverage, and so on.
The current CEO Eric Bolton has led the company for over two decades and has been at MAA for nearly three decades. During his tenure, MAA’s total return performance has absolutely crushed that of its peers:
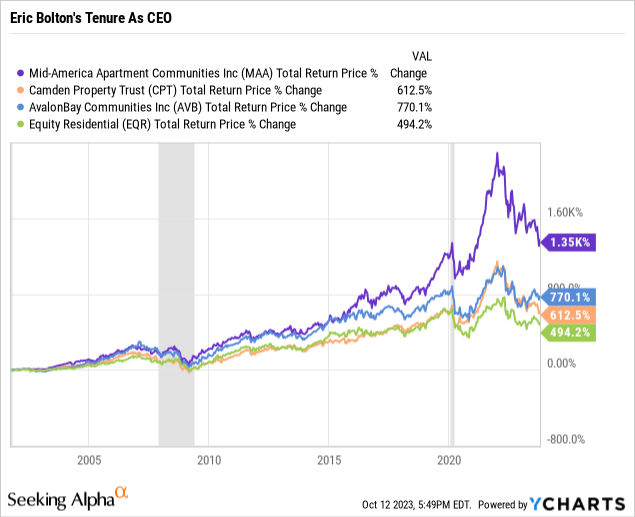
And yet, the market is pricing MAA at only a slight premium to its two closest Sunbelt multifamily REIT peers and a discount to its higher-quality coastal multifamily cousins.
| Price to FFO | |
| Mid-America Apartment | 14.4x |
| Camden Property Trust (CPT) | 14.0x |
| BSR REIT (OTCPK:BSRTF) | 13.3x |
| AvalonBay Communities (AVB) | 16.7x |
| Equity Residential (EQR) | 15.9x |
I’ll show below that MAA’s balance sheet remains in pristine shape, and the market has little to worry about on that front. It appears that the market has become concerned about the oncoming wave of supply scheduled to come online in MAA’s select cities over the next year or two.
I would argue, however, that this wave of supply will only be a temporary headwind, and that the current stock price decline represents a phenomenal buying opportunity for this best-in-class landlord.
Quality In The Numbers
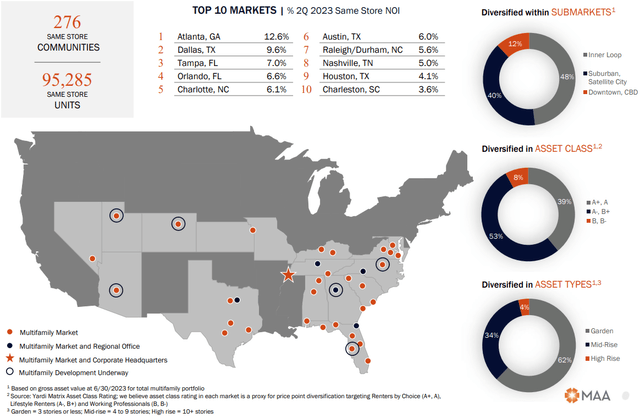
MAA owns a Sunbelt-concentrated yet meaningfully diversified portfolio of apartment complexes stretching from Las Vegas, Nevada to Norfolk, Virginia.
MAA September Presentation
In addition to a heavy presence in major Sunbelt cities like Atlanta, Dallas, Tampa, and Orlando, MAA also has significant exposure to fast-growing secondary markets like Jacksonville, Greenville, and Charleston.
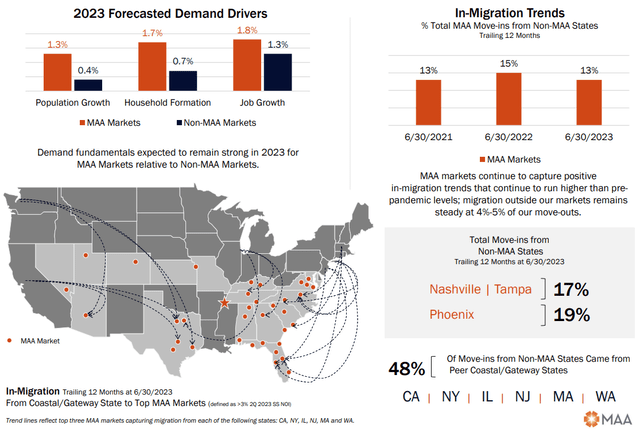
These Sunbelt markets have enjoyed population and job growth well above the national average over the past several years but also over the decade preceding COVID-19.
MAA September Presentation
The factors that drive these domestic migratory trends have not changed. Housing costs remain higher in many non-Sunbelt states, while lower taxes across the Sunbelt have attracted many businesses and jobs. Moreover, crime rates and rampant homelessness have fueled a population outflow from many coastal cities.
MAA’s median resident age is 34 years old, and the average rent-to-income ratio for newly signed leases sits at 22%.
As I explained in a recent article titled “‘Higher For Longer’ Is Totally Unsustainable: Buy Defensive Dividend Stocks,” homebuying affordability has reached a nearly four-decade low as both home prices and mortgage rates keep rising. The practical result of this will be that many would-be homebuyers will have to remain renters until homeownership becomes more affordable. This is great news for multifamily landlords like MAA, because a rent-to-income ratio of 22% is far more affordable than the alternative of buying a home right now.
Another competitive advantage for MAA is its robust development and redevelopment platform, which was significantly bolstered by its acquisition of Post Properties in 2016. Post had expertise in property development that has clearly been beneficial to MAA over the years since the acquisition. Today, most of MAA’s portfolio growth comes from internal development projects.
This development arm, in addition to MAA’s redevelopment platform that constantly upgrades a portion of its apartments with the latest technologies and interior designs, keeps the portfolio fresh and in tune with renter preferences.
What’s more, MAA is able to deliver internally developed properties at stabilized yields of 6-7% or higher. For development projects currently in the lease-up phase, MAA expects to generate a stabilized NOI yield of 7.2%. This is a massive strength at a time when multifamily cap rates are in the 4-5% territory.
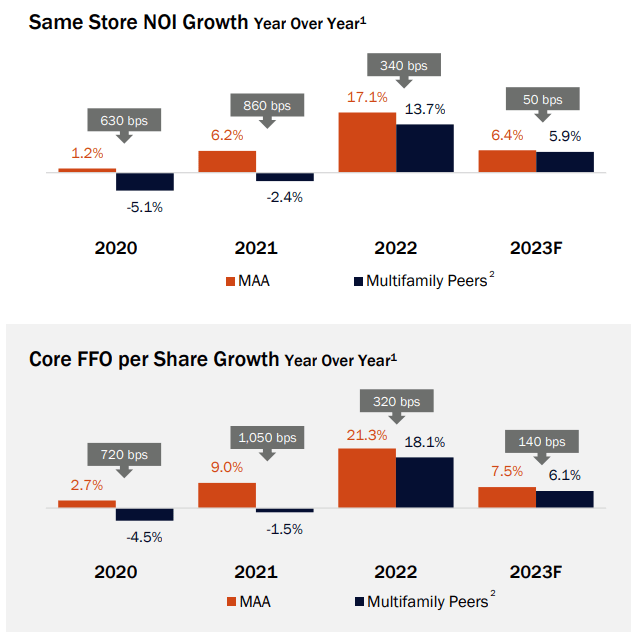
The above investment approach has worked extraordinarily well for MAA over the last few decades. We see it in the numbers. Compare, for example, MAA’s Q2 core FFO per share and same-store NOI growth to that of its peers:
| Q2 Core FFO/Share Growth | Q2 SS NOI Growth | |
| MAA | 12.9% | 8.6% |
|
CPT |
5.6% | 6.2% |
| BSR | 5.3%* | 11.7% |
| AVB | 9.5% | 5.4% |
| EQR | 5.6%** | 5.4% |
*Uses AFFO instead of core FFO
**Uses NFFO instead of core FFO
Granted, this is only one quarter. But if you zoom out further, you’ll find more evidence of MAA’s outperformance over its peers.
MAA September Presentation
Quality isn’t always easy to describe, but it does tend to be quantifiable in performance numbers. That is certainly the case for MAA.
The Oncoming Wave of New Supply
The market seems to think that Sunbelt multifamily REITs’ time in the sun has come to an end. The period of very low-interest rates from the second half of 2020 through early 2022 spurred a surge in new development starts in the multifamily space, focused on the areas where people were moving during the pandemic. This includes the suburban areas of coastal cities and pretty much everywhere across the Sunbelt.
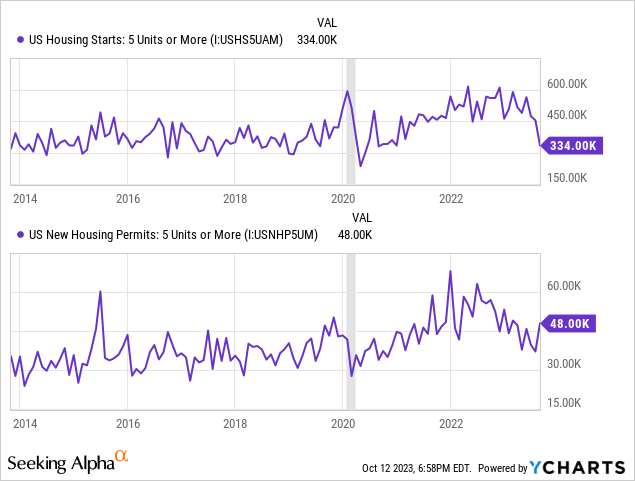
Notice in the chart below how multifamily construction starts averaged about 500,000 in 2022, compared to an average of under 400,000 during the 2010s.
A large share of these new apartments are going to be delivered in MAA’s Sunbelt markets.
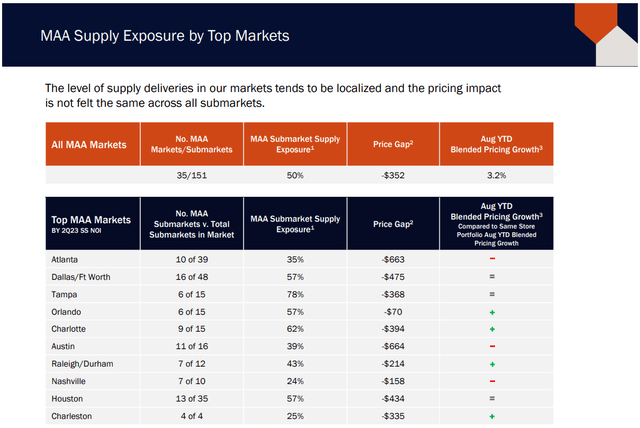
The market seems to think these new units will compete directly with MAA’s existing portfolio, which is not necessarily the case. MAA enjoys at least two competitive advantages amid this wave of new supply:
- Superior locations
- Lower rent rates
You can see both competitive advantages displayed in the illustration below.
MAA September Presentation
First, in many of MAA’s markets, the submarkets where the REIT’s properties are located are expected to receive only a fraction of the total supply coming to those cities. MAA’s communities often enjoy superior locations that offer greater convenience in terms of proximity to highways, shopping centers, and workplaces.
Second, MAA’s existing portfolio is able to offer rent rates significantly below the asking rents of these newly delivered apartments. Everyone knows that construction costs have gone up a lot in the last few years. Plus, developers typically have high-interest rate construction loans in place. That, in addition to the desire to sell the stabilized property for top dollar, requires them to seek out the highest possible rent rates.
Thus, the primary competitors of newly delivered apartments tend not to be existing apartments but rather other new apartments. These new apartment communities will likely have to offer concessions such as one or a few months of free rent in order to get leases signed at these higher rent rates. But in most cases, it is unlikely that they will drop rents low enough to compete with MAA’s existing apartment stock.
Plus, notice in the chart above that both construction starts and building permits for multifamily properties have dropped significantly below their 2022 levels. High-interest rates have caused starts to plummet. This means that the wave of new supply will be severely curtailed starting sometime in 2025.
The supply headwind is temporary.
In the long run, I would worry more about the supply pressures urban apartment landlords in coastal cities will face from office-to-multifamily conversions. Cities like New York City, San Francisco, Los Angeles, and Chicago with lots of old, half-empty office buildings and local governments that are desperate to revitalize their downtown areas (and therefore likely to subsidize conversion projects) are more likely to face a secular trend of apartment supply growth than the Sunbelt.
According to a recent study put out by researchers at New York University and Columbia Business School, the top five metro areas with the most potential office-to-multifamily conversions were (you guessed it):
- NYC (634 buildings)
- San Francisco (358 buildings)
- Los Angeles (254 buildings)
- Washington DC (155 buildings)
- Chicago (113 buildings)
Due to greater office utilization and less public transportation, the Sunbelt is at a much lower risk of apartment supply growth from office conversions in the long run.
Balance Sheet Safety And Opportunity
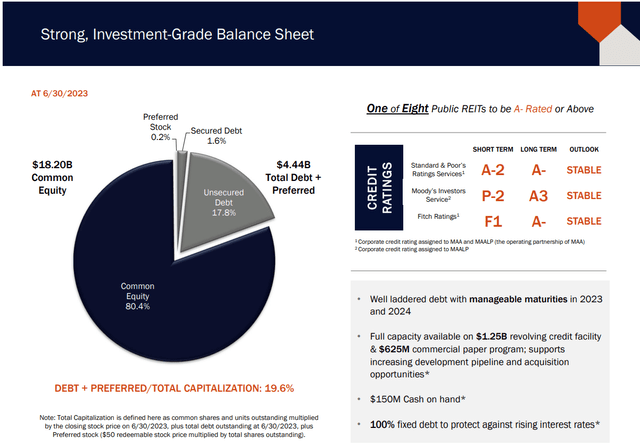
MAA has among the strongest balance sheets, if not the strongest, in its multifamily REIT peer group. It is not the only multifamily REIT with credit ratings of A-/A3…
MAA September Presentation
…but it is the only REIT with 100% fixed-rate debt and net debt to EBITDA as low as 3.4x.
| Net Debt To EBITDA | |
| MAA | 3.4x |
| CPT | 4.2x |
| BSR | ~6x |
| AVB | 4.1x |
| EQR | 4.3x |
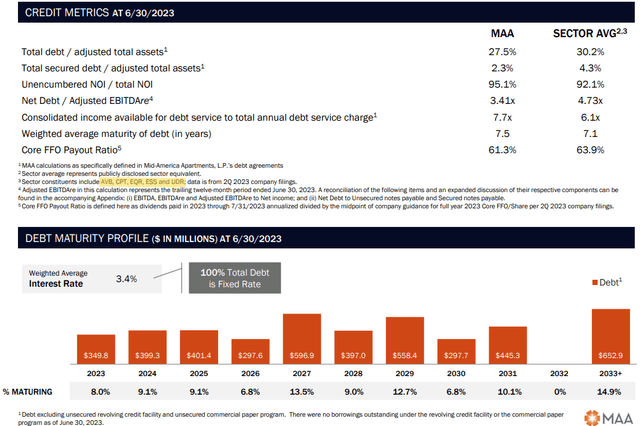
But net debt to EBITDA is only one metric to measure balance sheet strength. There are others, and they all show MAA well-positioned compared to peers.
MAA stacks up well against its peer group average in terms of debt to assets, unencumbered assets, debt service coverage, and weighted average debt maturity.
MAA September Presentation
Notice the small highlighted section showing that the “peer group” constituents include AVB, CPT, EQR, Essex Property Trust (ESS), and UDR Inc. (UDR). In other words, MAA is only comparing itself to the largest and strongest multifamily REITs, not any of the smaller ones with weaker balance sheets.
The REIT does have a steady slate of debt maturities to refinance in the coming years. That is perhaps the weakest aspect of the balance sheet. Even if the bond market is favorable to MAA, the REIT will likely have to roll over these loans at new interest rates at least 200 basis points above the weighted average interest rate of 3.4%, based on the current average effective bond yield for corporates with an “A” rating.
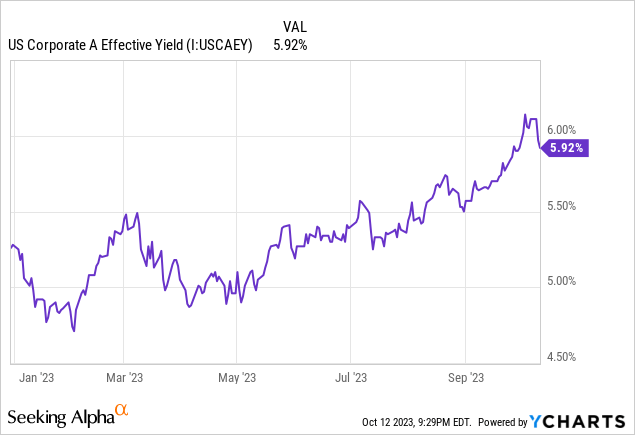
The good news is that MAA has plenty of liquidity as well as significant retained cash from its low payout ratio. This should help it blunt the blow of refinancing at higher rates.
Certainly, up until now, MAA has managed to avoid rising interest expenses. Just the opposite has been the case. MAA’s interest expense has declined since 2019 (i.e. the trailing twelve-month period ending at the beginning of 2020).
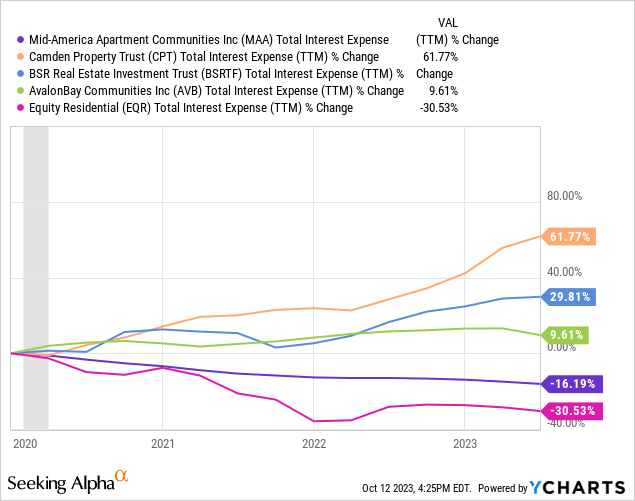
Perhaps the only reason why EQR’s interest expense has fallen more than MAA’s is that EQR has been a net seller of assets in order to deleverage. Notice in the chart below that while MAA’s total assets have crept up since the beginning of 2020, EQR’s total assets have declined by about 5%.
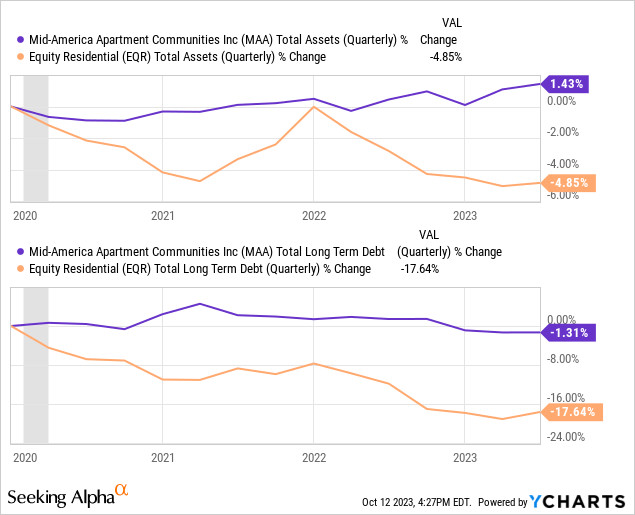
EQR sold properties in order to reduce its debt load, while MAA has not needed to sell properties to reduce its debt.
As more supply comes online and developers get desperate to offload properties amid high-interest rates, MAA’s management believes that they will soon be able to utilize their significant dry powder ($1.25 billion capacity on the credit facility plus $150 million in cash) to scoop up attractively valued acquisitions.
Bottom Line
MAA is best-in-class in the multifamily REIT space because of its:
- Concentration in fast-growing Sunbelt markets
- Skilled and long-tenured management team
- Fortress balance sheet and high credit rating
- Diversified portfolio across multiple types of properties, locations, and price points
- Size, scale, and efficiency
- Capacity to pounce on attractive investment opportunities
This explains why it is my largest multifamily REIT holding and why I view it as a phenomenal buying opportunity right now.
There will be mild to moderate headwinds in the short term from supply deliveries and debt refinancing, but MAA will be able to navigate these slight headwinds far easier than the market seems to think.
What the market seems to ignore is demand: the Sunbelt is growing, and would-be homebuyers are largely stuck in the rental market for the foreseeable future.
Editor’s Note: This article discusses one or more securities that do not trade on a major U.S. exchange. Please be aware of the risks associated with these stocks.
Read the full article here








Leave a Reply