
Dear Investors,
Through the end of the second quarter of 2024, the Massif Capital Real Assets Strategy was up 9.4% net of fees, with YTD gains from both the long and short books.
Our most significant positive return in the second quarter came from our position in Enovix (ENVX), which returned 6.7% for the portfolio. Siemens Energy (OTCPK:SMEGF), our best-performing position in the first quarter, maintained positive momentum, generating a portfolio-level return during the second quarter of 3.6%. We had strong contributions from all our mining names except Lithium America (LAC) and Lithium Argentina (LAAC), which dragged on portfolio returns by 3%.
|
Annualized Returns Across Various Time Periods (As of 6/01/2024) |
YTD |
3 Years |
5 Years |
Since Inception |
|
Massif Capital Real Assets Strategy (Net of Fees) |
9.4% |
3.1% |
10.3% |
9.7% |
|
Performance of Massif Capital Universe |
||||
|
Massif Capital Universe (MktCap > $675 Mil) |
4.6% |
3.7% |
5.6% |
6.7% |
|
Massif Capital Universe (MktCap < $675 Mil) |
-13.7% |
-10.3% |
-4.1% |
-2.6% |
|
General Market Indicies |
||||
|
Russell 2000 |
1.7% |
-2.7% |
7.0% |
9.3% |
|
S&P 500 |
15.3% |
10.0% |
14.8% |
17.2% |
|
S&P Real Assets Equity TR Index |
-0.9% |
1.3% |
3.6% |
6.4% |
|
Boomberg Total Return Commodities Index |
5.1% |
6.1% |
8.0% |
7.8% |
|
Industry ETFS |
||||
|
iShares MSCI Global Energy Producers |
7.8% |
15.5% |
5.7% |
6.5% |
|
iShares MSCI Global Metals and Mining |
-5.2% |
-2.9% |
6.3% |
8.1% |
|
iShares Global Industrials |
6.0% |
4.3% |
8.1% |
10.6% |
|
Alpha Vs. Russell 2000 |
||||
|
Real Assets Strategy (Net) |
7.1% |
6.4% |
5.3% |
|
|
Massif Capital Universe (MktCap > $675 Mil) |
1.8% |
1.1% |
1.4% |
|
|
Massif Capital Universe (MktCap < $675 Mil) |
-16.5% |
-7.7% |
-6.5% |
From a factor perspective, within the context of the Axioma Worldwide Medium Horizon factor model, all our second-quarter returns were generated from alpha, with a factor drag of 1.3%. Market sensitivity, a measure of the portfolio’s 2-year weekly beta versus the global market, produced the most significant drag (0.81%). At the same time, a series of fundamental factors (Size, Profitability, Earnings Yield, and Leverage) accounted for the remaining factor drag. Overall, the portfolio performance during the second quarter was a strong stock-picking performance, with alpha accounting for more than 100% of returns and minimal factor drag.
Where Are We?
Our letters do not usually delve too deeply into macro and general geopolitical discussions, preferring to stick to company discussions. Still, the market performance during the year’s first half has prompted some bigger-picture thinking we believe is worth sharing.
Figure 1: University of Michigan Consumer Sentiment Survey InflationExpectations Data
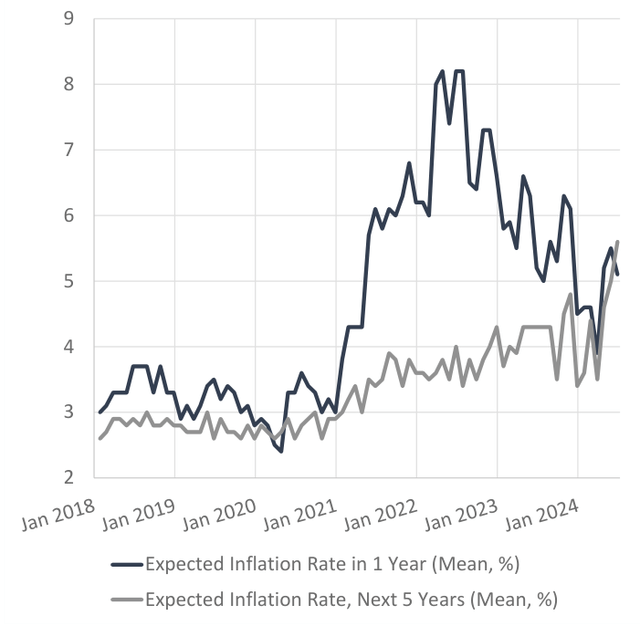
Source: Bloomberg, Massif Capital
Despite the Federal Reserve raising interest rates by 5.25% since early 2022, inflation remains stubbornly high in certain corners of the economy (but not all), and inflationary expectations, as measured by indicators such as the Fed 5Y Break Even Inflation Rate and 5Y5Y Inflation Swaps, remain elevated. We believe this last point is crucial as we tend to think that inflation is, to put a twist on a famous phrase uttered by Milton Friedman, always and everywhere, a behavioral phenomenon. While financial industry and economist-oriented measures of inflation expectations are still high, they are not alone; consumer expectations are also stubbornly high. The University of Michigan Consumer Sentiment Survey presents an interesting picture of the challenges; while inflation expectations for 1-year ahead (Blue Line in Figure 1) are in a downward trend, something inexplicable and worrisome is happening in the long end. The Grey Line in Figure 1 answers the question: Do you think prices will be higher, about the same, or lower 5 to 10 years from now? And by what percent per year do you expect prices to go up, on average, during the next 5 to 10 years?
Consumers are still unconvinced that inflation has been tamed. The immediate experience of paying higher prices, which is different from experiencing continued inflation, is still a driver of consumer impressions of where prices are going, even if coincident economic indicators suggest otherwise.
In defense of the consumer’s impressions, we would point to inflationary pressures building in various parts of the economy that we believe will help keep prices elevated even if inflation cools further, for example, Freight Rates for container shipping, see Figure 2. While they are not at the peaks we saw in 2021, they are about 260% above the 2017-mid 2020 average. What will prompt a reset in these prices? The shipping industry needs to see incremental capacity expansion, which can be accomplished by the existing fleet traveling faster or increasing the number of vessels working. Alternatively, we could ship fewer goods and products, an unlikely outcome.
Figure 2: WCI Composite Container Freight Benchmark RatePer 40-Foot Box. The WCI Composite is a weighted averageof eight globally critical shipping routes.
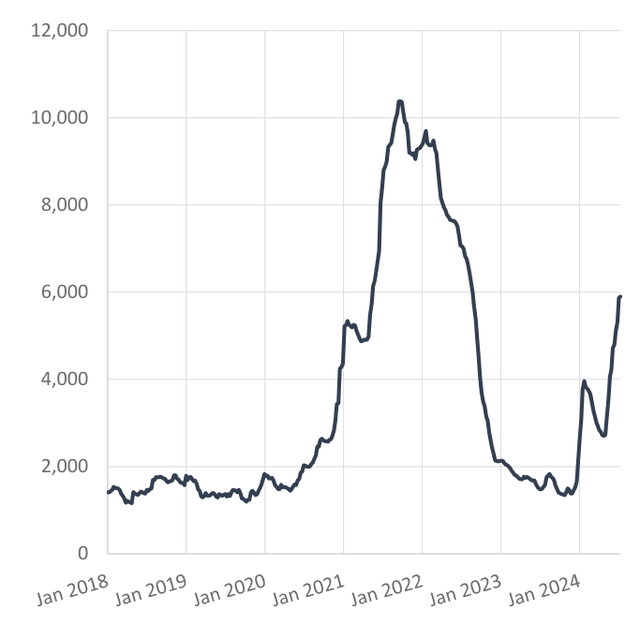
Source: Bloomberg
The slower pace of travel (slow steaming) is a function of oil prices, as ships use less bunker fuel when slow steaming, and environmental regulations. For example, starting in January, vessels traveling to or from the EU must pay for their emissions under the EU Emissions Trading System. The first deadline for surrendering allowances under this cap-and-trade system will be September 2025. Bloomberg New Energy Finance estimates it could cost vessel operators $65 billion by the decade’s end, leaving significantly less for investment in new builds.
Increasing the number of trips vessels are currently taking is difficult, particularly on shipping lanes that might traditionally have used the Red Sea, where tensions continue to prompt most traffic from the Indian Ocean to take the long way around the Horn of Africa. A lack of cheap decarbonization options such as clean-fuel supply, limited infrastructure, and international policy coordination will make it an uphill battle for maritime transport to slash emissions of around one gigaton of carbon dioxide annually, equivalent to 2.8% of the global total.
Port congestion in Asia has deteriorated sharply in recent months since the onset of shipping disruptions in the Red Sea. The number of vessel calls at key Asian ports has climbed 6% since last October; vessel rerouting has impacted port infrastructure, while unusually strong seaborne-trade volumes resulting from an early peak season as exporters attempting to mitigate potential delays have amplified congestion.
According to Clarkson’s data, the order book for container ships is 20% of the fleet. This sounds like a lot, but it is about 185 bps below the 10-year average. Like all shipping industries, container shipping is plagued by boom-and-bust cycles fueled by a rush to order new ships during good times. This will inevitably happen again, but it will only combine with the abovementioned issues to drive pricing volatility. In short, it seems difficult to foresee a way to achieve sustained lower shipping prices.
We can see similar trends in various commodities as well. Figure 3 shows the generic copper curve at the time of writing, one year and five years ago. The trend is clear: copper is getting more expensive. A combination of demand and supply challenges drives this trend. The long-term upward trend will be supported (not without interruption) by the challenge of building new copper mines. Copper is used in everything from houses to cars and cell phones. If the cost continues to increase, consumers will feel it; they will not know the cause but will see it. Equally problematic, it is the type of foundational cost increase that cannot be resolved quickly. The time-to-build problem for container ships takes a few years to resolve, the time-to-build problems for copper supply take decades to resolve.
Figure 3: Generic Copper Futures Curves
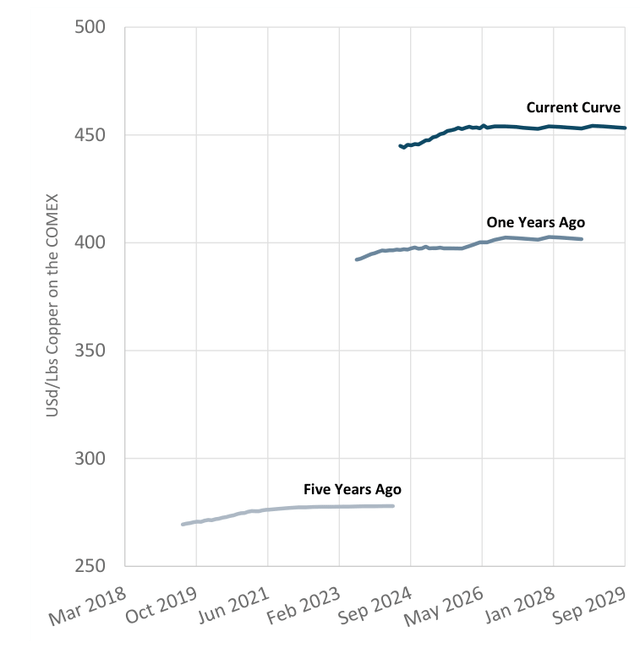
Source: Bloomberg, Massif Capital
While inflation at the economy-wide level is downward trending but stickier than ideal, it remains alive and well in many sectors of the economy. This is a serious concern for any economy, but especially one that appears headed for a change in political leadership intent on erecting significant and widespread tariffs.
Moving from the real world to the world of financial instruments, we see the penumbra of supply-driven inflation. Stocks are at all-time highs, and credit spreads are narrow. This suggests that despite the rate hikes, excess market liquidity has not been fully absorbed and has instead been misallocated into a financial bubble, laying the foundation for real asset inflation because capital has not flowed to productivity-enhancing investment but rather to nonsense (cryptocurrencies and meme stocks). As Richard Bernstein recently noted in an FT Opinion piece, there is precedent for such a setup:
When the technology bubble began to deflate in March 2000, the overall stock market began the “lost decade,” during which the S&P 500 had a modest negative annualized return for ten years, but energy stocks, commodities, emerging markets, and smaller caps performed extremely well. From March 2000 to March 2010, the S&P 500’s annualized total return was negative 0.7 percent a year, and the S&P 500 Technology sector was down 8.0 percent a year. However, the S&P 500 Energy sector was up 9.4 percent a year, the S&P Small Cap Index was up 6.6 percent a year, and the MSCI Emerging Market Index was up 10.0 percent a year. Those segments benefited from the reallocation of capital away from technology stocks but also from post-bubble inflation spurring their profits. The Fed’s past could be the prologue. Capital is again being misallocated within the economy, yet the Fed still doesn’t seem to appreciate that misallocated capital kindles future inflation.
In summary, inflation is trending down, but consumers are concerned about future inflation. Rightly so, to the degree that capital continues to be deployed in the economy in ways similar to the last five to ten years, real assets will not be built, precluding even the possibility of a smoothly operating low-inflation economy. The misallocation of capital in financial markets is a trend we have observed before.
The Philosophical Case for Investing in The Real Asset Ecosystem
In 2020, we authored a paper entitled Failure to Impact: Are ESG Funds Delivering on Investors’ Ambitions? Our core argument was a critical observation that ESG funds did not invest in businesses that actively advanced solutions to the Environmental, Social, and Governance issues that ESG investors said they were concerned about. Instead, these funds were skewed towards businesses that merely avoided creating a negative impact, which is significantly different from making a positive impact.
The philosophical root of our argument was that investment that does no harm does not functionally address any problems and could worsen them through a misallocation of capital. To address the issue, you must invest in a business looking to tackle the problem. Investing in companies that ease the economy’s evolution from a high-pollution state to a low-pollution state can make a profound difference. Still, those businesses necessarily need to be either polluting businesses or focused on polluting industries. This meant heavy investment into what we termed the real asset ecosystem.1
Our call for increased investment in the real asset ecosystem is still unanswered. With time and further study, the importance of unmade investments into the real asset ecosystem has become ever more critical, with impacts far beyond climate change and the inflationary concerns observed above. What do we mean? Take, for example, the following dramatic causal chain:
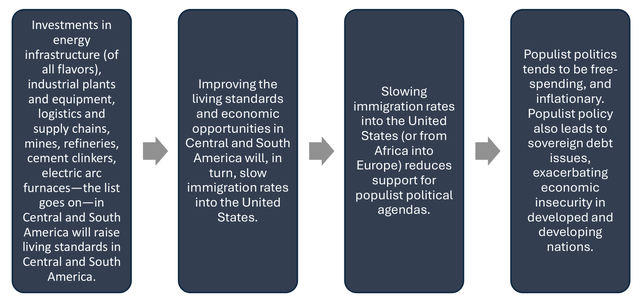
This is an overly dramatic causal chain, but as Benjamin Franklin noted in Poor Richards Almanack: “For want of a nail, the shoe was lost, for want of a shoe, the horse was lost, and for want of a horse the rider was lost.” What is the missing nail in this example: a sturdy economic foundation built on an industrializing economy (real assets) that offers citizens upward mobility and the basis upon which a more complex services and technology-driven economy can be built. Why is the US facing an immigration crisis at the border? Not because there is no border wall or because of the policies of any single administration. There is a border crisis because migration is a rational response to the economic situation many individuals in Central and South America find themselves in.2
The United States has a solid economic foundation built over eighty years of industrialization following the end of World War Two. Many states in Central and South America lack that economic endowment; unfortunately, in the West, this entire system is atrophying; absent renewal, the real asset ecosystem that underpins modern economies atrophies and decays. The real asset ecosystem, not Apple and Nvidia, keeps societal living standards high. Wherever we look, whether in Central or South America or the United States, the needed real assets investments are taking a backseat to anything “cooler.” What is even more impressive is that even those cooler things depend on the real asset ecosystem, and yet the needed investments to support those demands are not being made.
AI, as futuristic and cool as it is, is just a function of two variables at this point: energy and data. We are starting to recognize the importance of energy to that equation in the form of increased flows into utility equities. The GS Power Up America Index (GSENPOW), a basket of stocks expected to benefit from growing demand for power driven by electrification, data centers, and EVs, is up 58% over the last year. However, a quick influx of capital into equity markets does not come close enough; it needs to be sustained to change the investing behavior of the management teams of real asset businesses.
As evidence, look at the behavior of mining firm management teams. What did BHP do earlier this year when it decided its business needed more copper exposure? Management tried to buy another mining firm. Would the big purchase, which would have been one of the largest in mining history, have increased the global supply of copper? No, the current copper price is enough to incentivize a desire for more copper exposure, but it is not yet incentivizing far riskier investments in greenfield mine development.
Figure 4: S&P 500 P/E Diverging from Trend of Economic Surprises
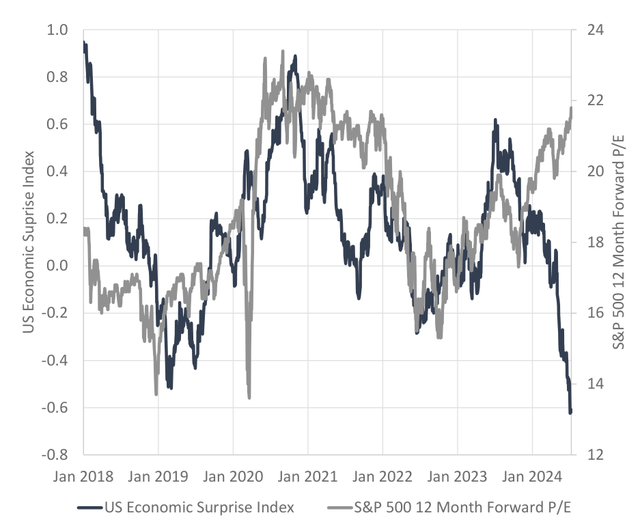
Source: Bloomberg, Massif Capital
Whether improving the quality of life in developing nations, producing a more environmentally sustainable economy, or advancing the most high-tech innovations, the real asset ecosystem underpins it all.
Humanity does not invest at its peril.
A Few Further, Less Philosophical Thoughts on the Economy and Equity Markets
US-listed stocks make up only ~25% of the portfolio, but US equity markets and the US economy are a bellwether for much of the world, so a modest deep dive seems prudent.3
In Figure 4, flagged by Chris Cameron of Bloomberg, the blue line is the Bloomberg US Economic Surprise Index, a measure of the difference between analyst forecasts of economic data and the reported data, and the white line is the S&P 500 twelve-month forward PE. The chart implies a sharp divergence between underlying economic data and the market; the surprise index indicates that economic data has surprised to the downside, compared to economist expectations, and that equity markets have just shrugged it off.
Figure 5: S&P 500 Actual and Modeled Returns Based on Economic Surprise
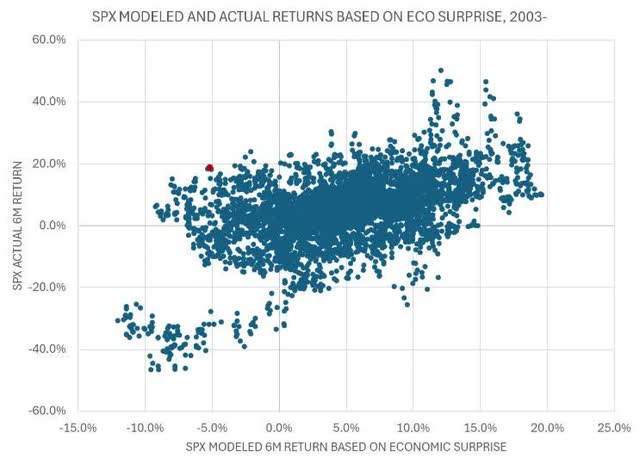
Source: Bloomberg (What Plunging Economic Surprise Means for Equities)
Figure 6: Nonfinancial Market Capitalization Over Nonfinancial Corporate Gross Value Added
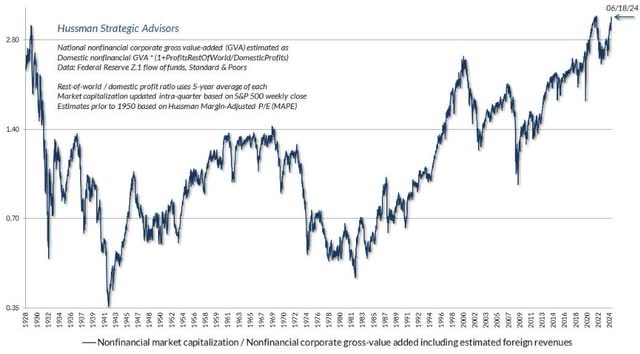
Source: Hussman Funds (You Can Ring My Bell)
As Mr. Cameron notes, a more extended history of this chart suggests the divergences in these two metrics are very noisy. Yet, when the economic surprise index is used to explain changes in the forwardlooking PE, there is a positive contemporaneous relationship between the two with a modest correlation coefficient of 0.5 for a six-month time frame (reasonable for financial relationships). Mr. Cameron follows this up by plotting the modeled 6M returns based on the Economic Surprise Index vs. the Actual Returns (Figure 5). With our present position marked in red, the chart looks equally ominous. This model is not the basis upon which a strong opinion about market directionality should be formed, but as we build a mosaic of the current environment, it bears keeping in mind.
Other works of a similar flavor, such as John Hussman’s ratio of Nonfinancial Market Capitalization over Nonfinancial Corporate Gross Value Added, seem to show something similar.
The clear levels of extreme mis-valuation shown in Figure 6 can be put in perspective in a similar way to how Chris Cameron contextualized the implications of the divergence between forward-looking PE and Economic Surprise by charting the estimate of 12-year S&P 500 total returns over and above treasury yields against actual subsequent 12-year returns (see Figure 7). We don’t look to be in a strong position.
Figure 7: Estimate 12-Year S&P 500 Total Return in Excess of Treasury Bonds
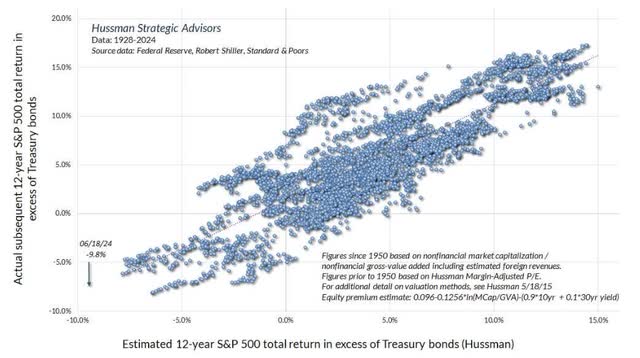
Source: Hussman Funds (You Can Ring My Bell)
The two examples of economic and financial data presented above suggest that a divergence between the underlying economy and equity markets is occurring, but that is not the whole story. While we believe that fundamentals shape liquidity flows in the long term, sentiment, narrative, and other technical factors shape liquidity in the short
term. This means that investor enthusiasm and risk appetite must be extinguished before the cold, hard truth of financial and economic fundamentals bites.
So, where does risk appetite stand now?
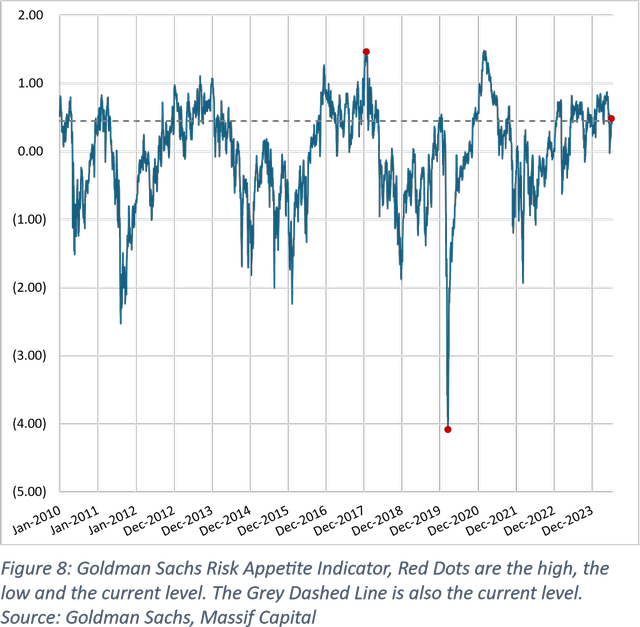
Headline risk appetite, as measured by the Goldman Sachs Risk Appetite Indicator, which is defined as the rolling 1-year z scores of several asset class specific risk indicators such as Equity Risk Premium, the performance of EM vs. DM equities, etc, suggests current risk appetite across all asset class is at an awkwardly high level, not quite a screaming high that warrants immediate action, but not at a level that does not warrant concern (See Figure 8). The measure has been higher 29% of days in the last ten years. Making it awkward, only twice in the previous ten years has it reached this level on the way up without going higher, but rarely has it gone higher by much, and only 2% of the time has it been more than one standard deviation higher. Although this sounds concerning, it is worth pointing out that the 2% of the time spent one standard deviation higher than the present, occurred in three different periods: December 2016, January 2018, and February 2021. The S&P 500 continued to move higher for the next 12 months in all but one of those instances, the January 2018 period. The half-life of risk appetite is strong, which is one reason why momentum is such a potent equity factor.
The picture is the same if we repeat the exercise for the index’s equity subcomponent. About 26% of days over the last ten years have been above the current level of risk appetite, but there have been seven instances in which risk appetite crossed above the current level without marching significantly higher before turning down, four of which have occurred in the last twelve months. Again, the implication is that risk appetite has a long half-life; otherwise, we would not have marched higher than we have over the last twelve months. Risk appetite is high, but is it high enough to indicate an impending turn in the market? That is less obvious.
If we turn to the Goldman Sachs Cross Asset Position and Sentiment Indicator, we find ourselves in the 66th percentile, a level we last crossed briefly towards the end of 2019/1st quarter 2020 and then again in 2021. We have only been higher than the 66th percentile on a sustained basis from 2013/2014 and 2016 to 2018. We can sum this up by saying that positioning is stretched. Stretched enough to warrant concern, sure, panic, no. This leads to a final and critical question: is there sufficient liquidity to allow animal spirits to run?
The answer, surprisingly, is that there does appear to be sufficient liquidity, at least in the US, an assessment made by looking across various financial condition indices. Despite high interest rates compared to the last ten to fifteen years, measures of financial conditions tend to signal a loose environment. This holds regardless of whether we are looking at the Goldman Sachs Financial Conditions Index, the Bloomberg Financial Conditions Index, the Chicago Fed National Conditions Index, etc. Loose financial conditions do not necessarily mean money can flow into financial markets, but it is a reasonable precondition.
Figure 9: S&P 500 Price Action vs. 2Q2024 Earnings Estimate
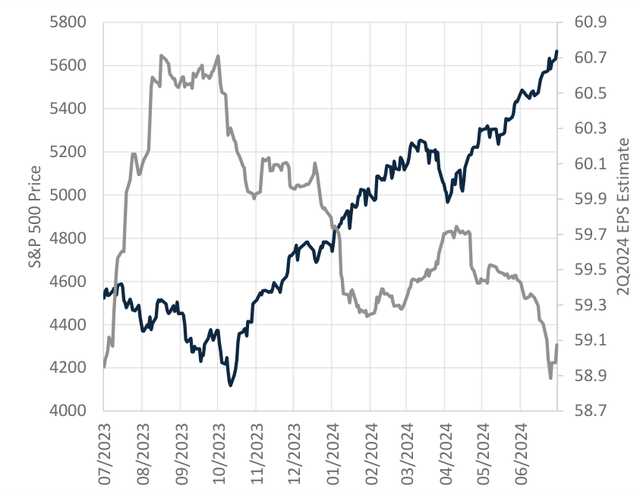
Source: Bloomberg, Massif Capital
From this multifaceted perspective, the elements for the market to continue to move higher appear in place. The key question from our perspective is, when do fundamentals matter? When does the longrun weight of corporate and economic fundamentals become the short-run sentiment that translates into negative flows into financial 5800 markets? This is a much harder question to answer; one variable we are watching closely in this regard is earnings expectations, a metric we think often produces a bridge from economic and corporate data to investor risk appetite.
Figure 9 shows analyst estimates for S&P 500 2Q2024 EPS (grey line) charted against the price of the S&P 500 (blue line). For context, the current estimate is $58.9, a YoY growth rate of 8%. A positive correlation exists between the S&P 500 EPS and GDP Growth; further GDP Growth often acts as a leading indicator for the S&P 500 EPS, particularly during an economic boom or crisis.
As a leading indicator, GDP changes tend to precede EPS by roughly one quarter. We suspect that economic activity is slowing sufficiently and will start to appear in EPS this quarter; whether that produces an outright fall YoY or QoQ in EPS vs. slowing growth is less clear. Economic data suggests a distinct slowing but not a recessionary fall. For example, at the consumer level, auto sales over the medium term are primarily flat, retail sales ex-autos and food have slowed, and credit card delinquencies at all banks are on the rise, now above pre-covid levels, but still below the average from 1991 to 4Q2019.
Zooming out to corporates, real investment in non-residential structures through the end of 1Q2024 continues to grow QoQ at the 10-year median. Manufacturing construction has slowed but remains well above the 10-year median (QoQ in 1Q2024 of 6% vs. the 10-year median of 2.5%). Employment, specifically private non-farm payroll growth, has slowed, and the NFIB Small Business Hiring Plans Index continues to trend down. Although it bounced off the lows set earlier this year, it continues to set lower lows and lower highs since it peaked in 2021. The outlook is certainly not encouraging, but it is far from clear we are teetering on the edge of a precipice.
This is a long and complex way of saying that although the future seems far cloudier than many Wall Street talking heads seem to believe, it also seems reasonable to postulate that current market momentum could sustain itself for a while longer. That does not mean we won’t get a mid-year correction; the first half of August is a notoriously tricky period for US equity markets and historically one of the worst-performing periods during any year since 1950. Seasonally, August is the month with the largest outflows from equity markets. Furthermore, since 1928, July 17th has marked the local top for the month, heading into a materially lower August, so our publication of this letter may very well coincide with an intra-year correction. Market tops are a process.
Nevertheless, the cracks in the economic foundation appear real, so caution is called for; as one sell-side desk we speak with put it, this is not the time for lazy positions. Given the environment, we are carefully harvesting some gains while staying fully invested, especially in high conviction positions showing strong positive momentum in the context of both the underlying business and the equity price action. At the same time, we are not avoiding deploying capital into new opportunities but are highly selective in the types of new positions we initiate. Event-driven situations with tight timelines are the order of the day, and we are also choosing to be more conservative in our initial sizing. Finally, we are also working hard to ensure that our database of readily shortable stocks is full.
Position Discussion
Strong results during the second quarter were driven primarily by four positions: Enovix, Siemens Energy, Alphamin Resources (OTCPK:AFMJF), and Reunion Gold Corp, which each accounted for more than 10% of our total return. Of those four, Enovix and Siemens were the most significant contributors, as they were during the first quarter. Our thesis on both is worth reviewing.
Enovix
Enovix is perhaps a bit of an outlier in our portfolio given that it is a battery manufacturer selling into consumer goods markets, but it fits nicely in what we believe to be the Massif Capital analytical sweet spot, businesses where science/technology, geopolitics/geoeconomics and energy/materials overlap. While some would argue that Enovix is inappropriate for a liquid real asset portfolio, the traditional definition of real asset businesses is dated.
Traditionally, real asset businesses are those that own and operate real estate, infrastructure, and natural resource assets. While this definition is workable, and most of the companies we invest in fall into one of these categories, it does not consider the ever-growing role of applied physical sciences in specific manufacturing fields, nor does it take into account the growing importance of material sciences and the changing nature of energy in general. Enovix is a material sciences business aiming to transform an ever-growing list of unique, highly refined materials into energy storage devices. They create value by understanding materials’ physical and electrochemical properties better than others.
To their clients, they sell batteries with superior energy density and safety properties. Before they can do that, they must first understand the materials they are using to construct a battery, specifically how the mix of materials interacts, and second, understand how to combine those materials in high volumes, at high speed, and with exceptionally low error rates. Mass production of superior batteries requires tight backward integration into the supply chain for commodities to achieve the desired outcome.
This does not make Enovix itself a real asset business, but its material demands and those of other companies that depend on ever-more-advanced materials shape commodity supply chains by introducing greater complexity in material refining, higher quality standards, increased needs for customization of previously commoditized products, sustainability considerations, and needs for innovative logistics. We contend that understanding businesses like Enovix and their potential necessitates understanding the upstream supply chain more than the downstream demand.
If you produce a better battery, there will be consumers; that is not in question. What is in question is whether you can make a novel product dependent on advanced materials at high volumes and with high yields. Answering that question requires understanding the material and applied science and the capabilities of the upstream suppliers to address unique downstream needs.
Turning back to Enovix, the investment thesis at 10,000 feet has always been that if the company can produce the unique silicon anode battery it has developed at scale, management will bring to market a battery that, at worst, is an incremental improvement over what is currently available. This, in turn, leads to demand and the opportunity for premium pricing and superior cash flow compared to other battery producers.
This year, Enovix management has advanced the company toward realizing this thesis in two ways. First, the management team has significantly progressed the build-out of the firm’s first manufacturing line. Second, the management team continues to build out its future customer base, which adds credibility to management’s claim that they can produce a unique silicon anode battery at scale, which still is an unproven claim but one that is fast approaching a point at which it will be proven.
While management has advanced the firm’s business, it is worth highlighting that it is still a pre-revenue company that has yet to produce a product at scale. This means that the spread of values for the business remains very wide, and the potential for market participants to misprice that value is exceedingly high. As such, we have continued to sell both put and call options on ENVX when the premium on offer in option markets is compelling. Given the stock volatility, the premium is often appealing. Our latest effort, a series of call positions entered shortly after the end of the second quarter, yielded a premium that reduced our average entry price by 9% and only resulted in a change in our position size at prices we would want to trim our position at anyway.
Siemens Energy
Year to date, Siemens Energy is up ~124% and up ~140% from our average entry price. We view this return as likely driven by investors pricing the stock based on a more thoughtful and informed valuation following a nasty sell-off last year, driven by the firm’s troubled wind turbine business.
Siemens Energy has two operating segments: Gas and Power Services (comprised of the gas turbine and grid technology businesses) and Wind Turbines. Gas Turbines, Grid Technology, and Wind Turbines businesses each account for ~30% of total revenue, with the remaining 10% coming from the firm’s transformation of industry division, which provides various niche services related to addressing the energy needs of industrial businesses. Last year, the firm sold off ~72% from its peak of €24.4 per share to a low of €6.8 based on issues solely associated with the wind turbine segment.
The specific issues that prompted the slide were quality issues affecting only 4% of the firm-installed Wind Turbine fleet. The company took a €1.6bn charge in Q3 and lowered its profit contribution from the future execution of Siemens Gamesa’s order backlog. The firm also took a €600 million charge to address production costs and ramp up challenges in the firm’s offshore segment. The stock dropped roughly 37% on these issues, announced in June/July last year.
In October, the firm announced that it was struggling to secure financial guarantees to serve as insurance to customers in case of a default on the type of long-term projects that Siemens Energy takes part in. Financial guarantees were difficult to secure because of the challenges in the wind turbine business.
Without added guarantees, ENR could not successfully bid on new projects for its Grid Technology and Gas Turbines and Power Plants segments. The firm’s shares sold off a further 35% on that news despite the positive underlying implications of the need for additional financial guarantees.
At the low in October/November of last year, the firm’s market cap bottomed out at ~€5.5 billion, vs. our estimate of the value of the business less the wind turbine segment but including liabilities associated with the wind turbine business of ~€15.5 billion. We added to our position several times between June and November, doubling its size.
Our thesis on the stock remains the same as when we initiated our position in 2022. The company’s products and services cover the entire electricity value chain from conventional energy generation to renewables and grid infrastructure, and with several thematic tailwinds to the stock, including decarbonization, energy demand growth, and grid infrastructure investment, all that remains is for management to prove it can profitably operate the business. On that front, management has made considerable progress in all areas except wind, a fact overlooked last year in the sell-off (See Figure 10).
While the returns from Siemens Gamesa (SGRE) are a drag on the business and require significant attention, management’s focus on the other segments over the last few years has yielded meaningful returns. Management has improved margins within the non-renewable businesses and aggressively grown the order backlog, with order intake rising by more than 60% since FY2017. Overall, the story of the Gas and Power business unit (formed of Gas Services, Grid Technologies, and Transformation of Industry starting in 2021) has been one of rising orders, improving margins, and more robust cash generation.
Figure 10: Margins at Individual Reporting Segments at Siemens Energy
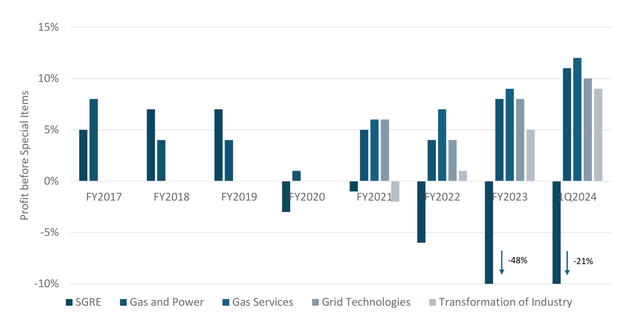
Source: Company Filings, Massif Capital
This year’s price rise is a recognition that Siemens Gamesa, although a clear overhang on the stock and the company’s performance, is just one piece of a larger pie. For the rest of this year, we expect the firm’s position as the world’s largest supplier of grid solutions5 and second largest producer of grid products6 to continue to support positive returns and look to 2025 and 2026 as years in which the rehabilitation of SGRE will start to positively affect the bottom line.
The grid business is experiencing significant growth, powered by increased demand for connecting renewables to grids in Asia, the US, and Europe and rising demand for grid services to deal with the electrical grid’s ever-greater complexity. Management expects to continue growing the grid business by low double digits, with double-digit margins for the near future.
The business’s barriers to entry are high, requiring significant technical and practical experience. For example, Siemens is one of only a handful of companies globally that produce large power transformers (LPTs) for the US Grid. Currently, only 20% of US large power transformer demand is met domestically (80% are imported, principally from Japanese and South Korean companies), with lead times of five years or more. Transformers are the critical equipment linking generation systems to distribution.
Recognizing the opportunity, gauging the political winds and the rise of national security-related protectionist concerns, Siemens is investing $150 million into its Charlotte, North Carolina facility to ramp up domestic production of LPTs. As far as we can tell, this is the only meaningful investment by market participants, even though the annual demand for LPTs has grown 22% since 2019 and is expected to grow a further 47% by 2030. For the US unit, Siemens needs to capture only 12% of the growth over the next six years to generate $150 million a year in revenue, equivalent to the 57 LPT’s management expects the plant to produce when in full operation. At that time, the US will still need to import 52% of the annual LPT demand (equivalent to 699 LPTs), suggesting ample room for growth after the first investment.
Although minor, the above example is an interesting case of the numerous niche opportunities that exist in the electrical system; on the other end of the spectrum, Siemens Energy, in consortium with Spanish firm Dragados Offshore, has signed an agreement with German-Dutch transmission operator TenneT to supply high-voltage direct current transmission technology for three grid connections that will ensure 6 gigawatts of offshore wind power can be transported back onshore. This contract has a value for Siemens and Dragadow of €7 Billion.
Meanwhile, other European Transmission System Operators are ramping up spending. National Grid expects to spend £42 billion over the next five years on transmission, grid infrastructure, and E.On expects to spend €26 billion on transmission infrastructure. A review of capex plans presented by European transmission system operators suggests that planned transmission infrastructure investments could double between 2026 and 2030 compared to today’s levels. This is why Siemens Energy needed further financial guarantee capacity.
Lithium
No Massif Capital letter would be complete without examining something that is not working or that we got wrong. Thus far this year, the clear winner is our expectation that lithium would make a rebound. Lithium prices have continued to sell off, with lithium hydroxide and carbonate in China down ~10% since the start of the year and the lithium mining sector, as measured by the Global X Lithium ETF, down 18%. The fund’s two lithium investments, Lithium Americas and Lithium Argentina, are down 48% and 46%, respectively.
While the story with Lithium Americas, a development company focused on building an exceptionally large lithium asset in Nevada, is complicated, the story with Lithium Argentina is similar to the situation in Siemens Energy last year. The market tossed the baby out with the bath water. The firm’s Cauchari asset in Argentina is a bottom-cost quartile brine asset that is fully built, went into operation last year and continues ramping to full commercial production on schedule. At a 10% discount rate and $12,000 per ton lithium in perpetuity, we still think the firm’s 44% ownership stake in the mine is worth $6 a share, 82% above the current price. At $18,000 per ton, the mine is worth more than $15 a share to the company. The operating leverage to the lithium price is fantastic.
While many have already written off the EV, the primary driver of lithium consumption via the needed batteries, we do not believe that read is correct. It is a highly US-centric commentary that does not even sync with what US automakers are saying. In that regard, we believe Ford CEO Jim Fairly’s recent comments at the Aspen Ideas Festival held in June are worth quoting:
“We as a company face a kind of ultimate fitness test on the question of making money on EVs, if we cannot make money on EVs, we have competitors [China], who have the largest market in the world, who already dominate globally, who are already setting up their supply chain around the world, and if we don’t make profitable EVs in the next five years what’s the future? Just shrinking to North America.”
Following a question on China Fairly continued with the concerning commentary that would imply that shrinking to North America is not even as bad as it could get:
“We have NAFTA; they [China] are 25% of the Mexican market already…We can all drive to Mexico, and one out of every four cars sold in Mexico is made by a Chinese company, and they will have enough [EV Manufacturing] scale in China to build plants there [referring to Mexico] and export tariff-free to the US.”
While we can certainly understand the backlash against government policies that encourage EV adoption, we struggle with the idea that EVs, still very much in the first commercialized generation, are not going to become commonplace absent government policies. For many use cases, the first generation of EVs is already a viable alternative to ICE; those who think the second and third generations won’t be improve lack imagination.
Let’s assume we are wrong and that they don’t improve enough to replace ICE cars in the US; the Chinese government has decided that their society will be driving EVs and that their companies will export them anywhere that will take them, which, given the low-cost models China offers, will be much of the rest of the world. If consumers in the US wish to be the last ICE holdouts 25 or 30 years from now, so be it. That will not meaningfully change lithium’s larger demand story, and it will not change the investment case for companies like LAAC, which is presently on sale for 66% of the book value of a brand-new mine that is less than a full year into a forty-year life.
As always, we appreciate the trust and confidence you have shown in Massif Capital by investing with us. We hope that you and your families enjoy the final months of summer and the start of fall. Should you have any questions or concerns, please do not hesitate to reach out.
Best Regards,
William M. Thomson
|
Footnotes 1The Real Asset Ecosystem is the Massif Capital shorthand for the universe of stocks we invest in, formed of commodity producers and the primary commodity-consuming sectors. Investing in the real asset ecosystem differs from investing in traditional real assets. We are looking to understand and capitalize not only on businesses that produce commodities but also on businesses downstream of raw commodity producers that have significant vertical linkages to commodity producers within broader industry value chains. 2Hein De Haas’s “How Migration Really Works” provides an excellent discussion of the drivers behind migration. 3The stock market and the US economy are different but related, and we foresee a tussle between the two as likely for the rest of the year. There are plenty of indications of a softening economy, but at the same time, that does not necessarily mean the market is facing an impending fall; there are plenty of examples of divergences between the two. 4https://repositori.upf.edu/bitstream/handle/10230/42502/TFGECO1819USGDPMora.pdf?isAllowed=y&sequence=1 5Grid Solutions: The design and management of High-Voltage Long-Distance power lines and associated software and technology, grid access services (connecting power plants or high-demand industrial facilities to electrical grids), grid stabilization services (increasing the reliability and stability of a complex grid with technology and software solutions), and Substations. 6Grid Products: Manufacturer and installation of transformers, switchgear, bushings, instrument transformers, and coils. Transformers transfer electricity from one circuit to another and can change the electricity voltage; switchgear protects electrical equipment from being overloaded, and the remaining products are used in substations, converter stations and throughout the transmission infrastructure. Opinions expressed herein by Massif Capital, LLC (Massif Capital) are not an investment recommendation and are not meant to be relied upon in investment decisions. Massif Capital’s opinions expressed herein address only select aspects of potential investment in securities of the companies mentioned and cannot be a substitute for comprehensive investment analysis. Any analysis presented herein is limited in scope, based on an incomplete set of information, and has limitations to its accuracy. Massif Capital recommends that potential and existing investors conduct thorough investment research of their own, including a detailed review of the companies’ regulatory filings, public statements, and competitors. Consulting a qualified investment adviser may be prudent. The information upon which this material is based and was obtained from sources believed to be reliable but has not been independently verified. Therefore, Massif Capital cannot guarantee its accuracy. Any opinions or estimates constitute Massif Capital’s best judgment as of the date of publication and are subject to change without notice. Massif Capital explicitly disclaims any liability that may arise from the use of this material; reliance upon information in this publication is at the sole discretion of the reader. Furthermore, under no circumstances is this publication an offer to sell or a solicitation to buy securities or services discussed herein. |
Original Post
Editor’s Note: The summary bullets for this article were chosen by Seeking Alpha editors.
Editor’s Note: This article discusses one or more securities that do not trade on a major U.S. exchange. Please be aware of the risks associated with these stocks.
Read the full article here