This stock was trading for less than a dollar in 2016 and surpassed 12 USD per share in 2021, this story impressed me and I decided to analyze the leader in advanced optical technology Luna Innovations Incorporated (NASDAQ:LUNA). Despite its impressive swings and shareholder returns, I think that you have to seriously reconsider your price expectations as I give it a “Sell” rating. Through the multiples’ analysis, I will analyze the company’s statements and show why I believe that the picture is not as rosy as it may be seen at first glance. Finally, I will come up with my price target.
Company Overview
Luna Innovations Incorporated provides high-performance fiber optic test, measurement, and control products for the telecommunications and photonics industries; and distributed fiber optic sensing solutions that measure the structures for industries ranging from aerospace, automotive, energy, oil and gas, security, and infrastructure. The communications test products help to test fiber optic networks that accelerate the development of high-speed fiber optic components. Distributed fiber optic sensing products help designers and manufacturers more efficiently develop new products by measuring stress, strain, and temperature at high resolution. Before 2021, the company had two segments: Lightwave and Luna Labs. Luna Labs performed applied research in areas of sensing and instrumentation, advanced materials, and health science. It represented around 30% of consolidated revenue. Luna Labs was sold to its senior management members, and financed in the form of cash and convertible and promissory notes. This transaction affects the statements to this day.
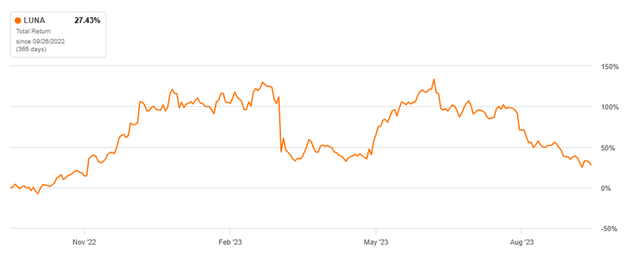
LUNA had an astonishing 27.43% 1-year Total Return to its holders with “Sell” Quant and “Buy” Wall St. Analysts ratings.

LUNA 1-year Total Return (Seeking Alpha)
Peer Analysis
|
Sector Median |
LUNA |
|
|
Total Return (1 year) |
-38.58% |
27.43% |
|
P/E Non-GAAP (FWD) |
21.28 |
20.39 |
|
EV/Sales (FWD) |
2.56 |
1.84 |
|
EV/EBITDA (FWD) |
13.66 |
15.54 |
|
P/Sales (FWD) |
2.55 |
1.56 |
|
EBITDA Margin (TTM) |
9.15 |
6.23 |
Most of the multiples suggest that LUNA is underpriced. According to industry median figures and 2023 earnings projections, it should be trading above 6 USD, which it does. Moreover, LUNA’s shareholders were luckier to have a positive 1-year Total Return compared to its peers. What caught my eye are EV/EBITDA suggesting the stock is overvalued and EBITDA Margin which indicates the problem with cash flow and profitability and suggests diving deeper into their financial statements.
Latest Quarterly Results

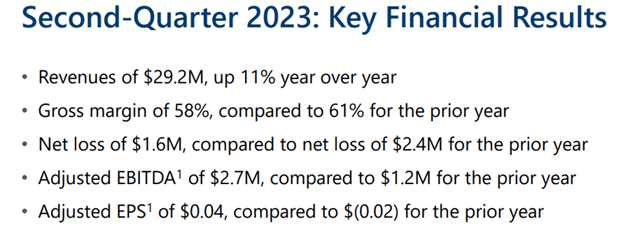
Second-quarter 2023 key financial results (the company`s supplemental materials)
The company provided revenue growth with a total half-year sales of 54.2M USD.
The projection for the third quarter is 29-32M USD which shows some doubts that even the lower bound of the yearly revenue forecast will be reached. But revenue figures are nothing if the company doesn’t show profits from them, and this is the case. Cost of sales and Operating expenses continue to negatively affect the results.
|
H1 2023 |
2022 |
2021 |
2020 |
2019 |
|
|
Cost of sales |
41.27% |
39.27% |
41.09% |
48.97% |
50.11% |
|
Gross margin |
58.73% |
60.73% |
58.91% |
51.03% |
49.89% |
|
Operating expenses |
|||||
|
General and administrative |
49.32% |
52.55% |
50.23% |
33.43% |
33.10% |
|
Research and development |
10.22% |
9.90% |
11.64% |
8.12% |
10.63% |
Gross margin is lower compared to last year’s second-quarter and full-year figures. Core operating income was affected by increasing R&D expenses, according to the company’s release, but as you can see from the table above its share didn’t increase much. The problem is the growing Cost of Sales, we will discuss it in the “Risks” section.
Risks
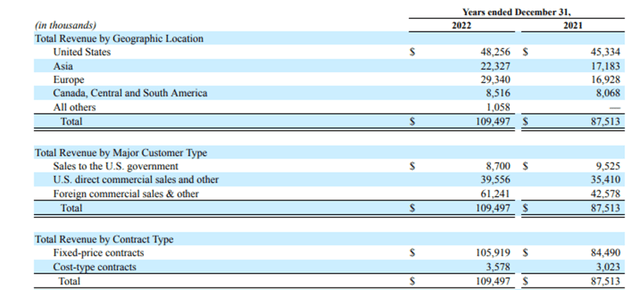
There are several risks concerning the outlook. Besides uncertainties in the global financial markets, there are big performance risks due to the contract types that prevailed in LUNA’s revenues. They have fixed-price and cost-based contracts. The first requires providing a scope of work for a negotiated fixed price, while the second reimburses all the contract costs incurred.

Revenue recognition (LUNA 2022 financial statements)
As you may see from the table above fixed-price contracts prevail which highly raised performance risks, affecting the cost of sales and thus the gross margin figures. Increasing inflation will continue to put pressure on costs.
Another risk that I want to mention is the performance metrics for the management bonuses. The company continues to give more weight to revenue figures in calculating the bonuses, which may result in increasing sales, but negative operating income.
Interest rate risks will continue to affect the performance of floating rate loan agreements the company has. Due to foreign currency exposure, exchange rate risks may affect the results.
Valuation Methodology
As the company has a negative cash flow and income from its core operations, I used a slightly different methodology than in my previous articles. I made future balance sheet projections depending on the company’s guidance and past structure. I calculated an excess return from core operations, but as they stayed negative, used abnormal operating income growth and discounted it. The required return is WACC-calculated. Balance sheet inputs depend on the sales figures of the company.
Valuation Inputs And Results
Despite my doubts, I used a lower-bound of 125M USD sales forecast provided by the company. I have simulated the future balance sheets and income statements to calculate the excess return on net operating assets and calculated the growth in excess return, which is an abnormal operating income growth. For the income tax federal statutory rate of 21% (provided from the annual statements) was used. The required return is WACC- calculated and equals 8.33% now. A growth rate of 4% is used in the continuing value.
With improving profitability, the return on operating assets will increase. Residual operating income is the difference between the required return and return on net operating assets. As the returns stay lower than the required interest rate, it is negative.
| Year | 2023 | 2024 | 2025 | 2026 |
| Tax rate | 0.21 | 0.21 | 0.21 | 0.21 |
| Sales | 125000 | 143750 | 163875 | 186817.5 |
| Cost of sales | 51585 | 60375 | 67189 | 76595 |
| Return on net operating assets | -1% | 0 | 2% | 4% |
| Residual operating income (ReOI) | -10899 | -10526 | -9202.6833 | -6690.325 |
| Abnormal operating income growth rate | 374 | 1323 | 2512 | |
| Discount rate | 1.08 | 1.17 | 1.27 | |
| Discounted ReOI | 345 | 1127 | 1976 | |
| Total Present Value (PV) of ReOI | 3448 | |||
| Continuing Value (CV) | 60343 | |||
| (PV) of (CV) | 47466 | |||
| Net operating assets 2022 | 115811 | |||
| Value of operations | 166725 | |||
| Net Financial Assets (NFA) | -22409 | |||
| Value of equity | 144316 | |||
| Number of shares | 33421 | |||
| Value per share | 4.32 |
In Thousands of United States Dollars (USD) except per share items.
Valuation Risk
The growth rate is outsourced from an expected US GDP and past performance and even a slight change will affect the price. If the growth rate continues to rise this year, it will result in a higher price target. Calculations don’t include options outstanding which will lower the price target. Due to accounting principles, some of the figures I used in my reformulation might be slightly off, but I tried to minimize their influence. The latest quarter statements and annual statements lack some disclosure, for example, product margins are not disclosed, making it difficult to forecast the performance — although this had only a minor effect on my calculations. WACC calculations are outsourced, but reasonably match my own.
The thesis is based on the fact that the company will continue improving and will reach lower-bound revenue figures. If the sales surpass and profitability increases, the price will be higher.
Potential Bullish Factors
My calculations are based on core operating income, not taking into consideration “other income”, such as “income from discontinued operations” and “share-based compensations”; which are included in EBITDA calculations.
As it seems from the previous results, it positively affected the final results. The current company’s (including acquisition) investments may create future value that is difficult to value now. I have to mention that the company usually has better 3-4 quarters (which is taken into account in their guidance).
Finally, the actual growth rate in operating income may surpass my expectations.
Conclusion
With the current market price of around 6 USD, it seems to me overvalued. This implies a significant growth rate in core operating income which is not happening at the moment. The company’s burn rate is increasing year-over-year which raises the risk of dilution of its shares. I would suggest avoiding this stock until it is clear that the company is improving its profitability. I assign a “Sell” rating and a $4.30 price target.
Read the full article here


Leave a Reply