By Levi at Elliott Wave Trader; Produced with Avi Gilburt
Soft landing. Hard landing. Recession, or worse according to some economic forecasts. What is one sector that ‘doesn’t necessarily move in line with economic credit cycles’? Might there be some setups out there that are pointed higher over the next year’s time? Let’s take a look at two in particular.
The Fundamental Framework

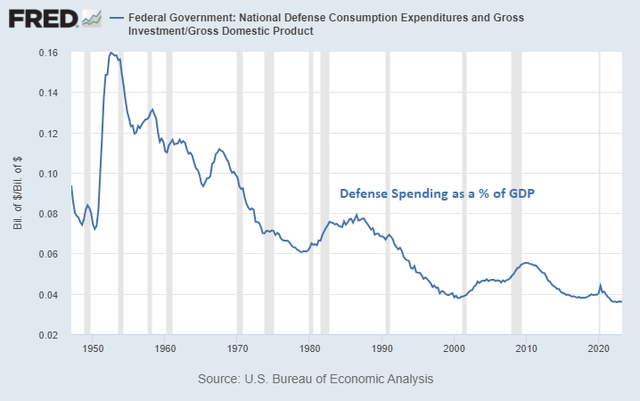
US Bureau Of Economic Analysis
This makes for an interesting foundation on which to build this thesis. Note Lyn Alden’s recent comments regarding stocks like (NYSE:LMT) and (NOC).
“Defense spending as a percentage of GDP has been on the decline in the United States for the past three decades. The fall of the Soviet Union in the early 1990s lessened the perceived need for high levels of ongoing military investment. However, with the rise of China as an emerging power, and with the ongoing war between Russia and Ukraine, the likelihood that defense spending begins to stabilize as a share of GDP and turn up is quite high. The defense industry can be a useful portfolio diversifier because it doesn’t necessarily move in line with economic credit cycles.”
We can now take that information and seek out the charts with the highest probability structures.
Wave Setups Are Pointing To LMT And Others
Wave Setups are stocks covered by our lead analysts, Zac Mannes and Garrett Patten, with the most interesting setups. These are setups at or nearing ideal support or with promising initial moves off important lows. To give you an idea of how many stocks are updated in a month’s time, there have been 49 stocks either updated or added to Wave Setups in the past 30 days. LMT is on that list. Let’s take a more in-depth look at the parameters.

Elliott Wave Trader
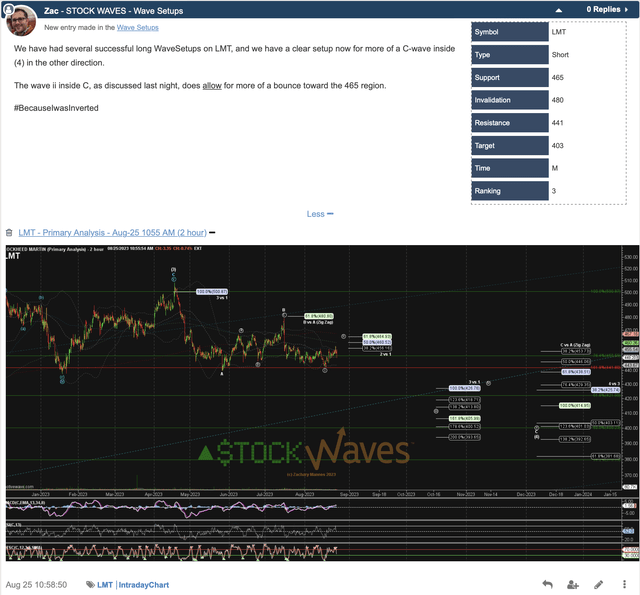
Back on August 25, Zac put out this new entry for a short setup in LMT. Note the guidance that was given regarding support and resistance. Also, keep in mind that in our Wave Setups tables, if it is a short setup, then resistance is actually support and vice versa. Ergo, Zac’s “Because I Was Inverted” tagline.
This setup proved quite prescient as the stock closed at $451 that day. By October 6, price had reached just beyond the lower target projected in the setup, striking $393. Quite the move in just 6 weeks!
But now, it’s time to flip the script from short to long as the corrective move appears complete for LMT.

Elliott Wave Trader
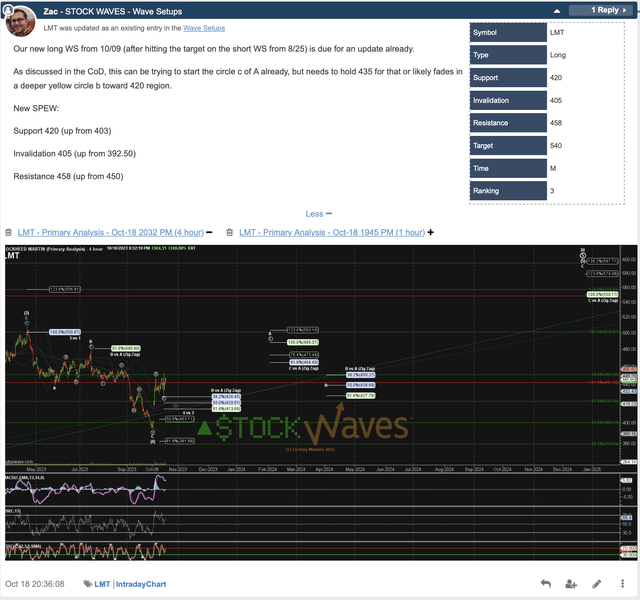
This current Wave Setup was actually published back on October 9th to our membership and then updated again on October 18th. At this time, we view LMT as having finished a corrective move and are looking for a move up from the last low to the larger target overhead as illustrated. It may take some time to complete this bigger structure, but in the meantime, there are plenty of zigs and zags to be caught, both up and down.
As you can see in the Setup table, invalidation of this current move would be at $405.
Bonus Coverage Of NOC

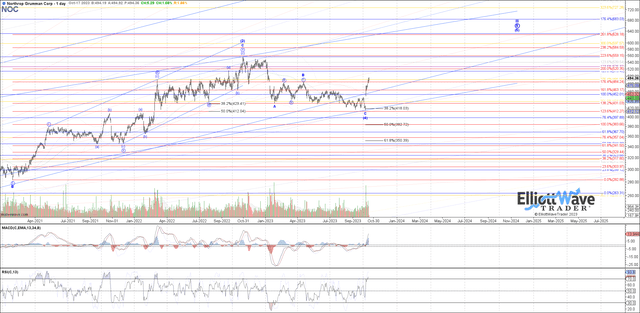
chart by Garrett Patten – StockWaves
Garrett’s chart projects higher for this one as well. In addition to NOC, there are several other plays that we are tracking in the same sector. As always, we will update these to members and include a few to the readership here.
Why Don’t More People Use Elliott Wave Analysis?
Have you ever asked this? Avi Gilburt penned a response to this very topic. Here is a brief excerpt from that article (this piece is available in its entirety in our Education section).
“First, many may not know this, but there are quite a few ‘name’ investors who do use Elliott Wave analysis in their decision making. One of the most popular is Paul Tudor Jones of Tudor Investment Corporation. Jones was quoted as saying:
“I attribute a lot of my success to Elliot Wave Theory. It allows one to create incredibly favorable risk reward opportunities”.
“Let’s start with the understanding that it takes a lot of detailed work and calculation in order to perform a proper Elliott Wave analysis. Moreover, it is a very complicated method to learn. So, the entry into this methodology is not easy and to perform a proper analysis is not easy. But, then, show me anything that is truly worthwhile that does not require an initial investment and hard work.
To this end, most of what I see being claimed as Elliott Wave analysis is nothing more than what I call ‘wave slapping’. This is when an analyst places numbers and letters on a chart based either upon the ‘look’ of the chart, or to support their prior bias about market direction. Since I would classify most analysis presented as Elliott Wave analysis as such, resultantly, most analysis is rarely correct more than 50% of the time. And, this lends to the argument about Elliott Wave being too subjective in nature.
So, when investors follow this type of ‘analysis’ and see how often it is wrong, they make the assumption that Elliott Wave really does not work, and are turned off.”
Conclusion
In addition to the articles provided to the readership here, we have an extensive Education library available at Elliott Wave Trader. As well, we want to teach others this methodology. Three times a week we have beginner and intermediate-level videos where we show the exact way we count the waves and give in-depth analysis techniques. This methodology, if you give it the chance, will change the way you invest forever. More on that can be found here.
There are many ways to analyze and track stocks and the market they form. Some are more consistent than others. For us, this method has proved the most reliable and keeps us on the right side of the trade much more often than not. Nothing is perfect in this world, but for those looking to open their eyes to a new universe of trading and investing, why not consider studying this further? It may just be one of the most illuminating projects you undertake.
(Housekeeping Matters)
If you would like notifications as to when our new articles are published, please hit the button at the bottom of the page to “Follow” us.
Read the full article here


Leave a Reply