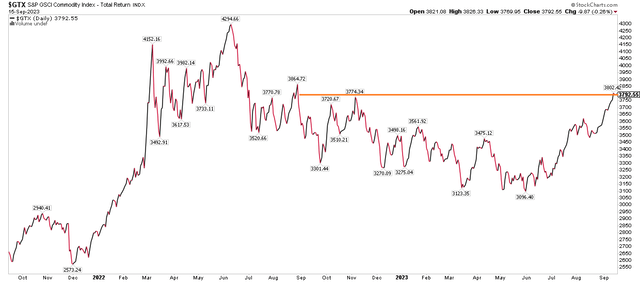
Commodities rallied last week to finish at the S&P GSCI Commodity Index’s best settle since August of last year. The 52-week high comes as the continuous prompt month of lithium futures is down a staggering 67% so far in 2023. Companies engaged in the niche have encountered high volatility, but impacts are mixed among the top holdings of the Global X Lithium & Battery Tech ETF (NYSEARCA:LIT) ETF. Moreover, the portfolio’s significant weight to Chinese companies has been a sore spot in 2023 given that market’s severe underperformance. LIT is -20% from year-ago levels, sharply lagging the S&P 500’s 16% total return.
I have a hold rating on the fund based on a reasonable valuation, but poor price momentum trends.
Commodities Soar in Q3, China Sags
Stockcharts.com
According to Global X, LIT offers investors exposure to the high-growth potential of lithium battery technology, a key component in the rise of electric vehicles (EVs), renewable energy storage, and mobile devices. Per the issuer, with Lithium-ion battery prices having dropped 89% between 2010 and 2021, EVs are becoming more competitively priced compared to traditional internal combustion engine (ICE) vehicles. The fund’s unconstrained approach spans companies across the entire lithium supply chain, from mining to refinement and battery production, providing diversification and opportunities across sectors and geographies.
The ETF has been in existence since 2010 and it tracks the Solactive Global Lithium Index. LIT comprises 40 holdings and currently manages assets worth approximately $2.75 billion, as of September 15, 2023. It comes with a somewhat high total expense ratio of 0.75%, and pays out dividends semi-annually – the current yield is 1.25% on a trailing 12-month basis. Liquidity is decent with LIT, as evidenced by its 30-day median bid/ask spread of nine basis points and average daily volume of more than 400,000 shares.
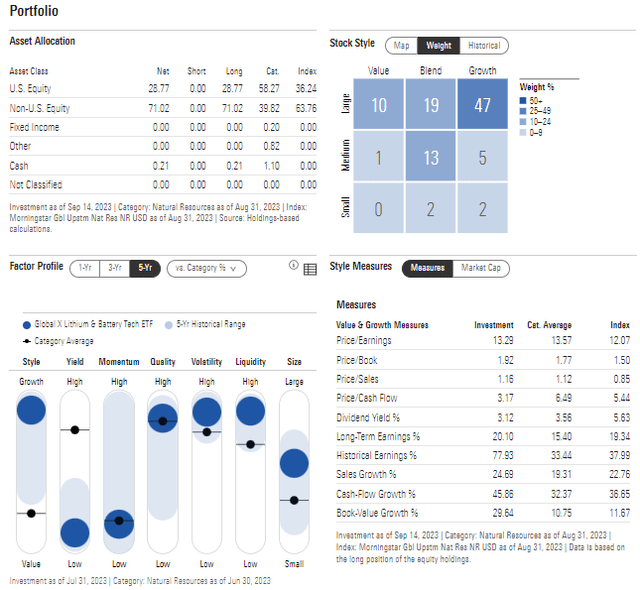
Digging into the portfolio, Morningstar data show that the fund is very much large cap in nature with less than one-quarter of the allocation in the small and mid-cap space. Also, growth investors may be more gravitated to LIT given its 54% exposure to that style and its mere 11% in value.
Global X lists the forward price-to-earnings ratio at a reasonable 17.4 as of September 14, 2023, while its prospective price-to-book ratio is under that of the S&P 500 at 3.0, though Morningstar’s estimates assert that the portfolio has better valuation metrics. The ETF’s beta is 1.07, making it a bit more volatile than the SPX. While liquidity is good, the fund has poor momentum right now, which I will detail later.
LIT: Portfolio & Factor Profiles
Morningstar
LIT is a concentrated ETF – an important risk for investors to consider. More than 40% of the allocation is in the cyclical Materials sector while 27% is invested in Consumer Discretionary stocks. The other two sectors are Industrials with a near-market weight of 16% and just 15.8% invested in Information Technology companies (sharply less than the weight of that sector in the S&P 500). Also adding to the volatility mix is a high 33% exposure to Chinese companies. Beyond that, there is good geographic diversification. Together, the top 10 stocks comprise 56% of the portfolio.
LIT: Sector & Country Exposures

Global X
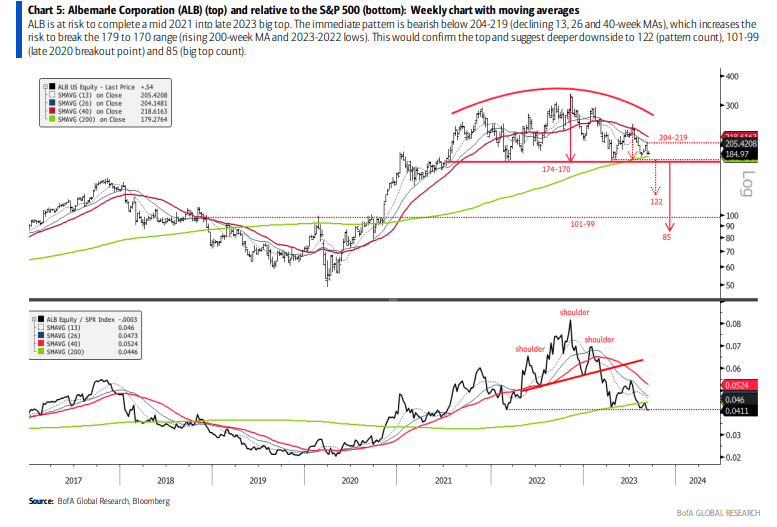
LIT’s largest holding, Albemarle (ALB), is also on breakdown watch, so says BofA’s Stephen Suttmeier. While this is just a technical view of one stock, it may portend broader risks for the lithium space.
ALB Major Rounded Top Formation
BofA Global Research
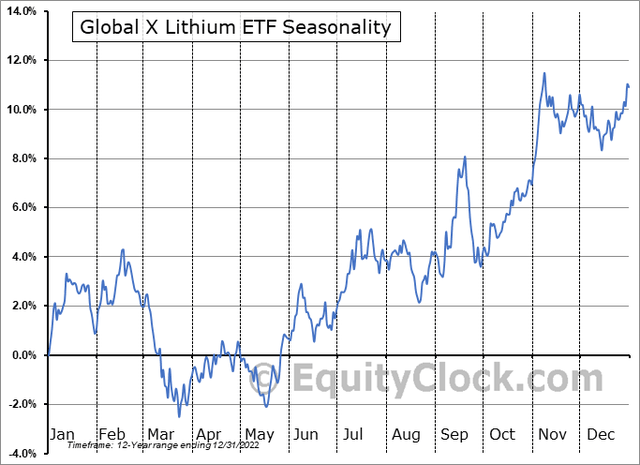
Seasonally, LIT tends to shine in October, climbing better than two percentage points with gains persisting into early November, according to data from Equity Clock.
LIT: Seasonal Tailwinds Late September-Early November
Equity Clock
The Technical Take
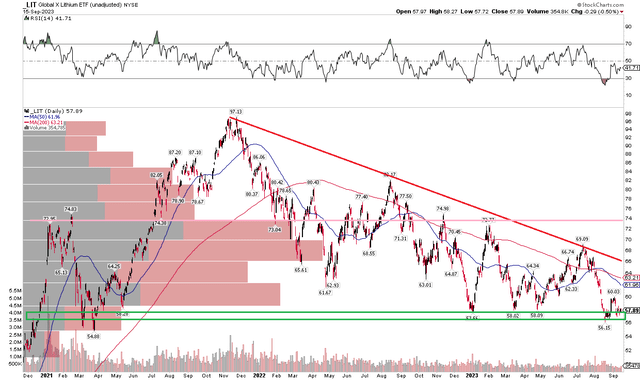
As commodity prices rise, leaving lithium behind, and amid ebbs in China’s growth outlook, LIT’s chart is concerning. Notice in the graph below that the fund is in a descending triangle consolidation pattern with key support in the $56 to $58 range. A breakdown below support would likely portend a move to the low $40s – where the fund peaked back in early 2018. With a high amount of volume by price from the upper $50s to mid-$70s, the bulls will have their work cut out for them on any significant rally attempts.
Moreover, take a look at the long-term 200-day moving average – it has been negatively sloped since Q2 of last year. That is a clear sign that the bears are in control. Furthermore, LIT’s latest dip under $57 leaves little room for the bulls to give up further ground – the August nadir was a fresh low going back to March of 2021. I see resistance near $74 – that has been a key point of polarity over the past few years and the top-end of where high volume has taken place. If LIT rallies above the mid to upper $60s, though, that would help support the case of a bearish to bullish turnaround.
Overall, it is a bearish chart, and the onus is on the bulls to defend support here.
LIT: Shares Probing Key Support, $74 Resistance
Stockcharts.com
The Bottom Line
I have a hold rating on the LIT ETF. While I like some of its big holdings, including Rivian (RIVN), a decent valuation is not enough to overcome a bearish momentum situation.
Read the full article here




Leave a Reply