
A month ago, we wrote an article on SPDR® Gold Shares ETF (NYSEARCA:GLD) forecasting a breakout to new highs. It was badly timed as a sudden increase in long -erm interest rates sent all financial assets lower, including gold and silver. But the decline quickly reversed last week with the price of gold rising 6%. So we want to update the situation and also finally establish a price target for GLD of $215.
GLD Price Target
This chart graphs the five-year price history of GLD and includes our breakout price target of $215 (red line). The indicators that support this breakout are the same as the previous article and will be updated in the sections below. The effect of higher rates on GLD is also discussed.
Essentially, we think the size and duration of the breakout will be about the same as last year’s move, which was a six-month rally of about 30%.
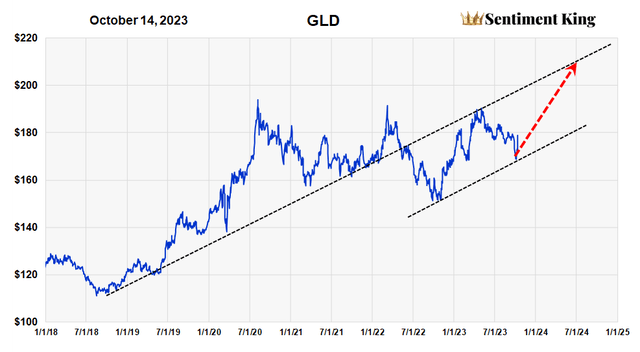
Long Term Chart of GLD with Our Forecast Shown by a Red Arrow (The Sentiment King)
The Effect of Interest Rates on GLD
Interest rate changes do affect the price of gold, and while one can debate which “term” affects gold more – long-term rates or short-term rates – we think the best metric to show the effect of interest rate changes on GLD is the 30-year T-bond rate. The chart below shows both GLD and the 30 year rate for the last five years.
Notice from the chart that rising rates almost always cause a decline in GLD and it was the recent rise in rates that spoiled our forecast and caused a sudden drop in GLD, which quickly reversed last week.
But it’s also important to notice something else; that “relative” peaks in interest rates almost always occur at local lows in the price of gold. We’ve highlighted these moments with three black arrows, with the most recent being the current situation.
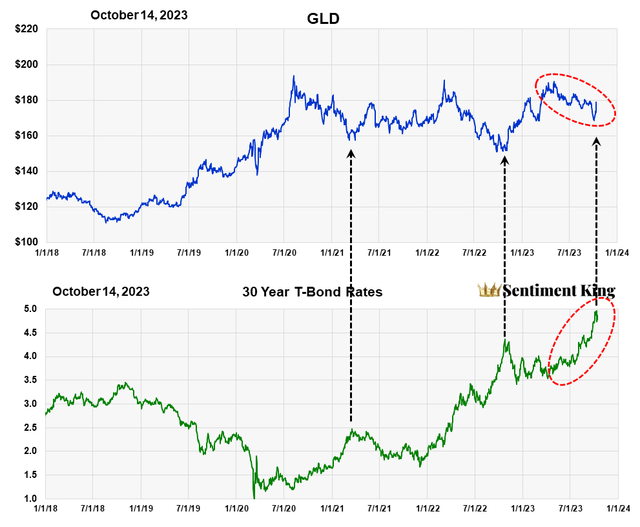
This chart shows the effects of long term interest rates on the price of GLD (The Sentiment King)
We’ve also highlighted with red ovals something else we think is important. Notice how mild the price decline has been over the last six months during a rather large increase in rates. This means higher rates are having less of an effect on the price of gold than in the recent past. To us, this implies that any increase in the price of gold will be much more dramatic given any decline in rates, however small.
The “Puts to Calls” Ratio of GLD Still High
This next chart updates the “puts to calls” ratio of GLD. It continues to show high ratios and heavy put buying in GLD, meaning investors continue to expect further price declines in gold. As you know this is a positive sign for GLD and the chart highlights past moments when this occurred with green arrows. Note the high ratio just a week ago, right before last week’s price surge.
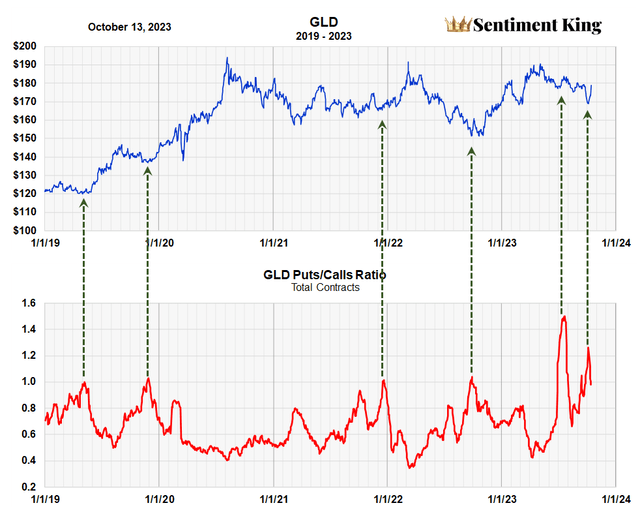
The GLD ‘puts to calls’ ratio is a contrary opinion indicator with a long track record. It divides the number of ‘put’ options purchased by the number ‘call’ options. The data is obtained from the CBOE. The P/C indicator was developed by Martin Zweig in 1972 for the entire stock market but it has value in forecasting many individual stocks and ETFs, too. We calculate the ratio over twenty days to get a long-term perspective. A high ratio represents bearish expectations, which is a positive indicator of higher prices. A low ratio represents the opposite. (The Sentiment King)
The COT Data Continues to Point to Higher Gold Prices
The commitment of trader’s data for gold futures has a long history of providing insight into the long-term trends of gold prices. By combining the ratios of long and short positions of gold producers with that of the money managers in a mathematically consistent way, we have developed an indicator that we think is valuable for forecasting long-term trends in gold.
This indicator was presented in the prior article and is updated in the graph below. It goes back to 2006. Notice how the latest value (circled in red) is pushing close to the green zone, which continues to be bullish for gold.
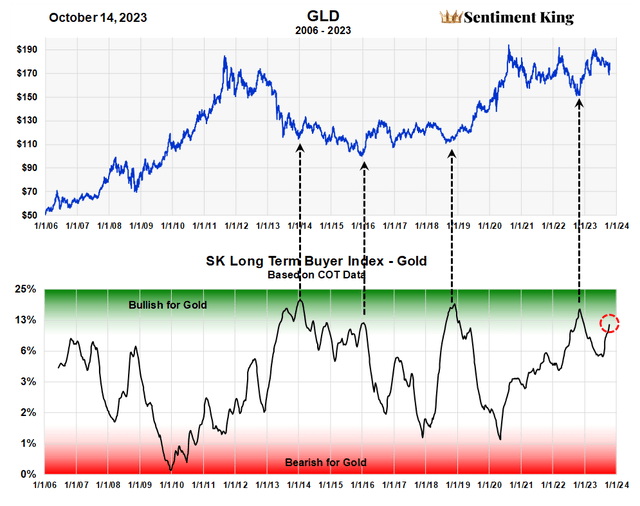
The Sentiment King’s Long Term Buying Index for Gold. It’s based on combining commitment of trader’s data for gold producers with that of asset money managers. It’s always positive if gold producers are long gold futures, and it’s likewise positive if money managers are short gold futures. Both conditions are bullish in themselves. Our index combines them and highlights moments when both conditions exist. The Green Zone readings are when money managers are short gold futures and gold producers are long. Red zone readings represent low short positions of the money managers and low long positions of the gold producers. (The Sentiment King)
Survey of Gold Newsletter Writers Also Indicate Higher Gold Prices
Surveys of newsletter writers in almost every market act as a contrary opinion indicator. When writers are overly bullish you want to become bearish, and vice versa. The same is true with the gold market.
Mark Hulbert has long kept track of what newsletter writers are saying about gold, and we found his information very valuable when forecasting GLD. Our Sentiment King ranking of his survey is found in the chart below. As of last week, newsletter writers were extremely bearish, which is a positive sign for gold prices going forward.
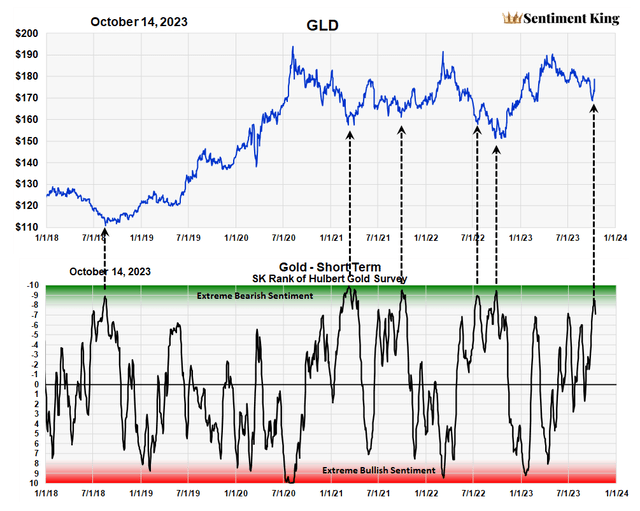
Mark Hulbert has long kept track of what newsletter writers are saying about gold on a daily basis. Records go back to before 2000. To gain a longer term perspective we take his daily numbers and perform a time weighted moving average on them. We then graph that number on the Sentiment King red-green ranking scale, which shows extreme bullish or bearish sentiment. It acts as the contrary opinion indicator. Green Zone readings, which represent extreme bearish sentiments, are bullish for gold. The opposite is true for the Red Zone. (The Sentiment King)
Summary
All the indicators we follow to forecast gold continue to point to higher prices. It’s been that way since our major buy signal in the summer of 2022.
Even though GLD is moderately correlated with both stocks and oil, we think GLD should be at least 10% of any stock portfolio because of this positive outlook. We think it will also help if global or political events cause unexpected market disruptions.
Read the full article here