Overview
iShares Russell 1000 Growth ETF (NYSEARCA:IWF), is an exchange-traded fund designed to track the performance of large-cap U.S. stocks exhibiting growth characteristics. It is managed by BlackRock and seeks to replicate the Russell 1000 Growth Index, composed of companies with strong growth potential in sectors such as technology, healthcare, and consumer discretionary.
IWF ETF provides investors with a diversified and cost-effective way to gain exposure to the growth-oriented segment of the U.S. stock market, allowing investors to participate in the potential upside of companies expected to experience above-average earnings growth. The ETF has an expense ratio of just 0.19%, representing its annual costs when investing in the ETF. Its assets under management (AUM) currently stand at $71.17 billion. It tracks the Russell 1000 Growth Index and falls under the segment of the MSCI USA Large Cap Growth Index. The ETF operates as an open-ended fund.
Holdings
ETF.com
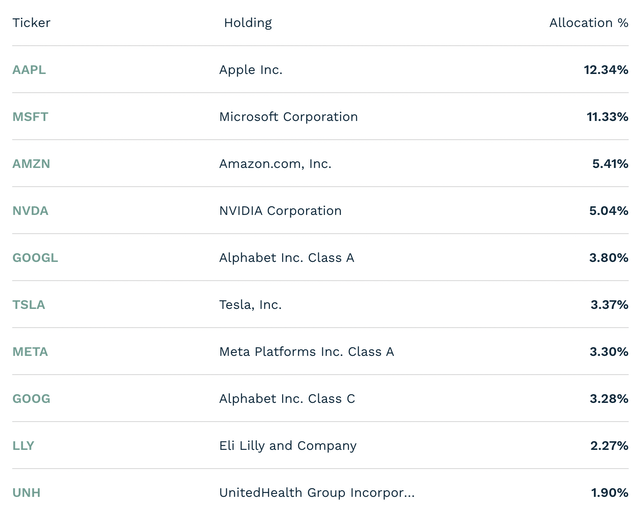
IWF top 10 holdings account for 52.05% of the total assets, while the remaining holdings make up 47.95%. The ETF consists of a total of 445 holdings, with the United States dominating the portfolio at 99.5%, and Canada contributing 0.5% of the holdings. Thus, the ETF is little diversified in terms of geographical diversification.
IWF largest holdings closely mirror QQQ’s top holdings, which tracks the 100 Index. In this regard, its largest holdings include consumer electronics giant Apple (AAPL), software colossal Microsoft (MSFT), E-commerce and cloud provider Amazon (AMZN), AI chip pioneer NVIDIA (NVDA) as well as Meta Search Engine and Cloud Provider, Alphabet (GOOGL). Thus, IWF top 5 holdings align with QQQ’s top 5 holdings with the exception for Alphabet, which is switched with Meta Platforms (META). Thus, IWF main difference for its top holdings, compared to QQQ are mainly its higher weight on Apple and Microsoft.
Performance

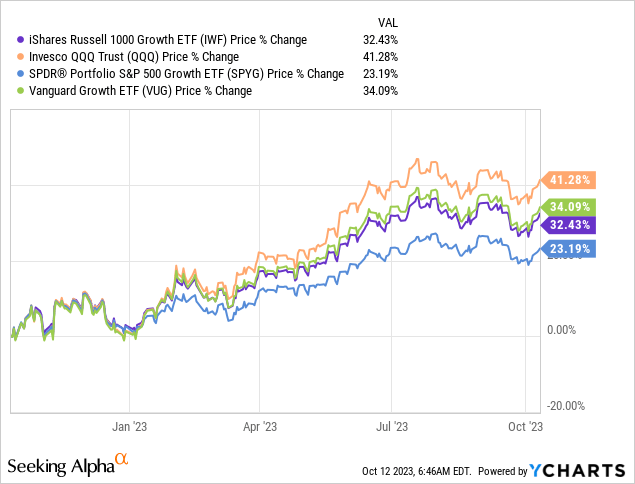
Due to its greater diversification and larger amount of holdings, IWF ETF slightly underperformed QQQ over the past year. In this regard, IWF returned 34% year-over-year (YoY), as opposed to QQQ, which returned 41% over the past year. The ETF also underperformed Vanguard Growth ETF (VUG) by a small margin. IWF and VUG ETF share many of their largest holdings, yet place a slightly different weight on its components, which is probably the main reason for the slight difference in performance. Here, VUG places a 5.4% weight on NVIDIA, compared to IWF’s weight of 5%. VUG is also more concentrated, as it has 236 holdings in total, compared to IWF, which has over 400 holdings.
However, the IWF ETF outperformed SPDR Portfolio S&P 500 Growth ETF (SPYG), a large-cap growth fund, holding roughly 300 companies selected S&P 500 companies based on sales growth and earnings growth. Thus, the ETF rather mirrors SPY, as opposed to QQQ, and also includes non-Tech companies, like oil and gas company Exxon Mobil (XOM). Since many stocks in the healthcare and energy sector underperformed the broader tech market, the ETF underperformed other well-known large-cap Tech ETFs. Overall, the divergence in performance of IWF other growth funds are mostly due to a slightly different weighting and rotation re-balancing of its holdings as seen by a nearly identical performance for most of the beginning of the year.
Valuations

Valuations of holdings in the IWF ETF have inflated slightly over the past year, as underlying earnings growth slowed less than feared, or even picked up significantly for many Tech stocks like Amazon and NVIDIA. As NVIDIA’s revenue and earnings surged over 100% in the previous quarter, the stock is trading 300% higher from last year. Similarly, Alphabet grew revenues by 3% last quarter, higher than anticipated, after a surge in revenue during the pandemic.
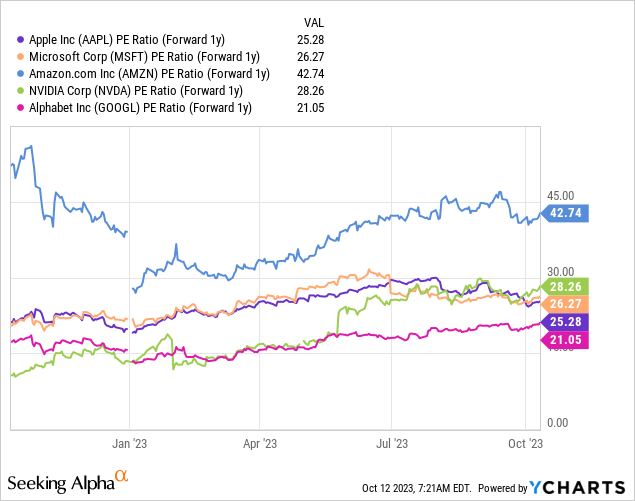
However, even on a forward basis, the largest holdings of IWF ETF are not trading at particularly cheap levels, based on traditional valuation metrics. Here, Alphabet, Apple, and Microsoft are trading at between 20-30 times 1-year forward earnings. While this may not seem that expensive, it is important to note that some of the stocks, like Apple and Microsoft traded at a 10 times forward P/E ratio back in 2013. Nevertheless, it is important to note that the stocks included in IWF are set to grow earnings quicker than the average market. For instance, Amazon’s Operating income increased to $7.7 billion in the second quarter, compared with $3.3 billion in second quarter 2022, marking a 133% increase year-over-year.
Overall, the price-to-earnings (P/E) ratio for the ETF stands at 34.37, with an average weighted market capitalization of over $1 trillion. The price-to-book (P/B) ratio for the ETF is 11.77, which is also relatively expensive compared to historical values. These measure are similar compared to QQQ, which has an average P/E ratio of 32.8, yet a lower average Price to Book ratio of 7.1. In comparison, the SPDR Portfolio S&P 500 Growth ETF (SPYG) has an average P/E ratio of just 25x.
Finally, the ETF has a distribution yield of 0.55%, which represents the dividend generated by the ETF on an annual basis.
Takeaways
IWF ETF provides an investment opportunity for capitalizing on major technological advancements like AI. Its low expense ratio and extensive diversification make it an excellent alternative to the popular QQQ ETF.
While investing in growth funds like IWF can offer substantial opportunities for returns, it also entails certain risks. These risks include high valuation, which can lead to price corrections if growth expectations aren’t met. High interest rate increases can also divert investor attention away from growth stocks, impacting their prices. Moreover, the inherent volatility of growth stocks can result in significant price fluctuations.
Read the full article here


Leave a Reply