
ILCG strategy
iShares Morningstar Growth ETF (NYSEARCA:ILCG) started investing operations on 06/28/2004 and tracks the Morningstar U.S. Large-Mid Cap Broad Growth Index. It has 392 holdings, a 30-day SEC yield of 0.54%, and a cheap expense ratio of 0.04%.
As described in the prospectus by iShares, “large-mid cap” stocks represent approximately the top 90% of the market capitalization of the Morningstar US Market Extended Index. The underlying index selects “companies that typically have higher than average historical and forecasted earnings, sales, book value and cash flow growth.” Then, constituents are weighted based on “the total value of shares that are publicly owned and available for investment.” The fund’s turnover rate in the most recent fiscal year was 28%.
ILCG portfolio
The fund is almost exclusively invested in U.S. companies (over 99% of asset value), mostly in the large and mega-cap segment (about 80%). Therefore, it makes sense to use as a benchmark the S&P 500 Index, represented hereafter by SPDR® S&P 500 ETF Trust (SPY).
The portfolio is overweight in the information technology sector (46.1% of asset value), followed by consumer discretionary (13.9%). Other sectors are below 10%. Compared to the benchmark, ILCG mostly overweights technology, and massively underweights financials, consumer staples, energy, materials and utilities.
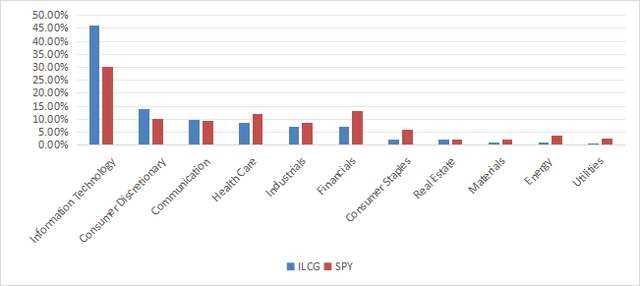
ILCG sector breakdown (Chart: author; data: iShares, SSGA)
The portfolio is very concentrated: the top 10 issuers, listed in the next table with growth metrics, weigh 56.7% of asset value. The top 3 names (Apple, Microsoft and Nvidia) represent more than one third of the portfolio.
|
Ticker |
Name |
Weight% |
EPS growth %TTM |
EPS growth %5Y |
Sales Growth %TTM |
Sales Growth %5Y |
|
MSFT |
Microsoft Corp. |
13.07 |
25.11 |
35.37 |
13.97 |
13.98 |
|
AAPL |
Apple, Inc. |
11.48 |
9.26 |
15.55 |
-0.90 |
7.59 |
|
NVDA |
Nvidia Corp. |
9.31 |
585.45 |
48.41 |
125.85 |
39.06 |
|
AMZN |
Amazon.com, Inc. |
7.04 |
763.59 |
23.55 |
12.54 |
19.80 |
|
GOOGL, GOOG* |
Alphabet, Inc. |
5.05 |
45.00 |
21.56 |
12.40 |
17.53 |
|
LLY |
Eli Lilly & Co. |
2.78 |
7.89 |
13.74 |
29.76 |
9.69 |
|
META |
Meta Platforms, Inc. |
2.5 |
115.95 |
14.46 |
21.62 |
19.29 |
|
TSLA |
Tesla, Inc. |
2.12 |
15.14 |
67.74 |
10.12 |
35.15 |
|
V |
Visa, Inc. |
1.79 |
19.92 |
13.80 |
10.19 |
9.64 |
|
MA |
Mastercard, Inc. |
1.56 |
25.70 |
16.16 |
12.75 |
10.94 |
* The two shares series of Alphabet Inc, listed by the fund as distinct holdings, have been grouped on the same line.
Fundamentals
The next table reports that ILCG is more expensive than the benchmark regarding valuation ratios and has better growth metrics, in line with the underlying index description.
|
ILCG |
SPY |
|
|
P/E TTM |
33.31 |
24.39 |
|
Price/Book |
8.46 |
4.26 |
|
Price/Sales |
5.08 |
2.79 |
|
Price/Cash Flow |
23.44 |
16.79 |
|
Earnings growth |
24.74% |
21.92% |
|
Sales growth % |
12.52% |
8.79% |
|
Cash flow growth % |
17.30% |
8.81% |
Data source: Fidelity
In my ETF reviews, risky stocks are companies with at least two red flags among bad Piotroski score, negative ROA, unsustainable payout ratio, bad or dubious Altman Z-score, excluding financials and real estate where these metrics are unreliable. With this assumption, risky stocks weigh only 5.8% of asset value, which is an excellent point. Additionally, according to my calculation of aggregate quality metrics (reported in the next table), portfolio quality is significantly superior to the benchmark. The aggregate return on assets is especially impressive.
|
ILCG |
SPY |
|
|
Atman Z-score |
14.05 |
3.71 |
|
Piotroski F-score |
6.64 |
6.03 |
|
ROA % TTM |
18.60 |
7.23 |
Performance
Since 7/5/2004, ILCG has outperformed SPY by 60 bps in annualized return, as reported in the next table.
|
Total Return |
Annual Return |
Drawdown |
Sharpe ratio |
Volatility |
|
|
ILCG |
672.69% |
10.83% |
-52.98% |
0.6 |
16.86% |
|
SPY |
593.47% |
10.23% |
-55.19% |
0.61 |
15.05% |
The growth fund has outperformed the benchmark by about 8% over the last 12 months:
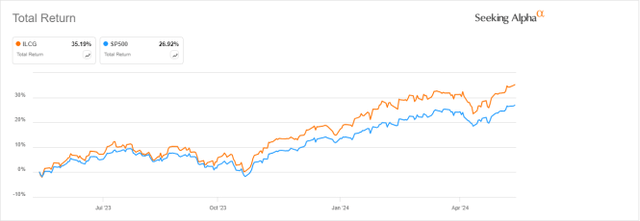
ILCG vs S&P 500, 12-month return (Seeking Alpha)
ILCG vs. competitors
The next table compares characteristics of ILCG and five popular growth ETFs primarily focused on large companies:
- Invesco QQQ Trust ETF (QQQ)
- Schwab U.S. Large-Cap Growth ETF (SCHG)
- Vanguard Growth ETF (VUG)
- iShares Russell 1000 Growth ETF (IWF)
- iShares Core S&P U.S. Growth ETF (IUSG).
|
ILCG |
QQQ |
SCHG |
VUG |
IWF |
IUSG |
|
|
Inception |
6/28/2004 |
3/10/1999 |
12/11/2009 |
1/26/2004 |
5/22/2000 |
7/24/2000 |
|
Expense Ratio |
0.04% |
0.20% |
0.04% |
0.04% |
0.19% |
0.04% |
|
AUM |
$2.23B |
$269.94B |
$28.32B |
$219.99B |
$92.36B |
$17.74B |
|
Avg Daily Volume |
$7.11M |
$19.53B |
$128.96M |
$339.67M |
$417.86M |
$54.20M |
|
Holdings |
392 |
102 |
250 |
203 |
444 |
479 |
|
Top 10 |
54.90% |
47.92% |
57.07% |
57.85% |
54.32% |
56.03% |
|
Turnover |
28.00% |
22.08% |
9.00% |
5.00% |
14.00% |
36.00% |
ILCG is the smallest and least liquid fund of this list (measured in assets under management and dollar volume, respectively). Its fee is on the cheap side.
The next chart plots total returns, starting on 12/14/2009 to match all inception dates. The Nasdaq 100 ETF is ahead of the competition and ILCG is the second-worst performer.
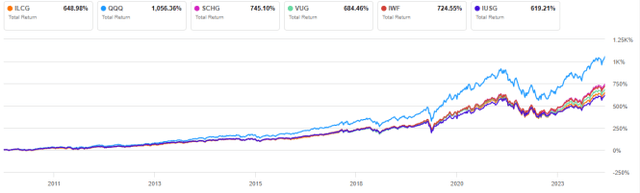
ILCG vs competitors, since 12/14/2009 (Seeking Alpha)
ILCG is also ranked second to last over the last 3 years:
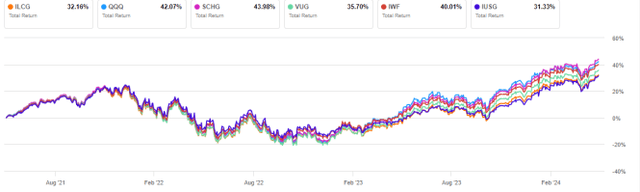
ILCG vs competitors, 3-year return (Seeking Alpha)
Takeaway
iShares Morningstar Growth ETF holds over 300 stocks with historical and forecasted growth characteristics. Like many growth funds, ILCG is overweight in technology and in a few mega-cap companies. ILCG has outperformed the S&P 500 since its inception in 2004. However, its performance has been underwhelming relative to competitors over the last 14 years. The growth ETF category has been dominated by QQQ for a long time, with SCHG appearing as a challenger in the last few years.
Read the full article here