
Thesis
In the ever-evolving landscape of the automotive industry, Stellantis N.V. (NYSE:STLA), forged through the merger of Fiat-Chrysler and Groupe PSA, emerges as a compelling entity. This conglomerate boasts an enviable portfolio of renowned automotive brands and an impressive track record, marked by a noteworthy annual revenue growth of 25%. However, as Stellantis charts its course into the future, it confronts multifaceted challenges, including the ongoing negotiations with the United Auto Workers [UAW] union and the risk of potential sales downturns. The ability to adeptly navigate these hurdles will prove instrumental in securing the company’s longevity and profitability. Yet, beneath these challenges lies a tale of optimism—a comprehensive valuation analysis reveals a substantial undervaluation of Stellantis stock. The present fair value per share stands at $49.19, representing an extraordinary 154% upside potential from the current stock price of $19.35. Additionally, a projected future stock price of $40.64 underscores an impressive 110% increase, translating to an annual return of 22%. To account for potential setbacks, the analysis includes a scenario where Stellantis’s revenue slumps to $100 billion in 2024 and then grows at a rate of 1.65% thereafter until 2028. Even in this conservative scenario, the fair value would be $35.85, reflecting an 85% upside and a 17% annual return, highlighting a substantial margin of safety. These compelling figures not only emphasize Stellantis’s financial prowess but also its potential as an undervalued investment opportunity in the automotive sector, and for those reasons, I rate Stellantis as a “Strong Buy”.
Overview
Company
Stellantis emerged as a result of the merger between Fiat-Chrysler and Groupe PSA. It serves as the parent company for a portfolio of renowned car manufacturers, including Jeep, Peugeot, Dodge, Ram, and Maserati. In essence, Stellantis boasts a diverse range of vehicles, encompassing everyday commuter cars to opulent luxury automobiles.
Stellantis
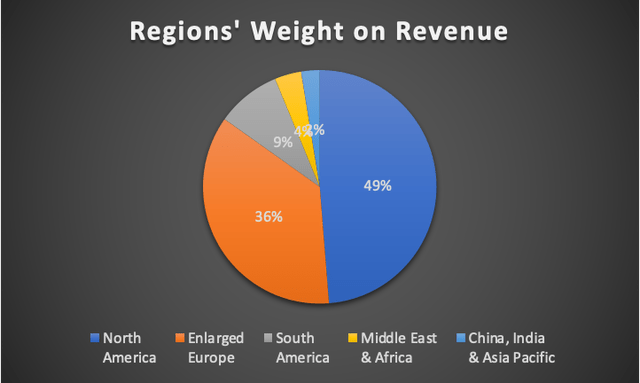
Stellantis maintains a global presence, operating across nearly every corner of the world, with its primary markets being North America and Europe. These regions contribute significantly to its total revenue, accounting for 49% and 36%, respectively.
Notably, Stellantis stands as one of the frontrunners in the European electric vehicle market, solidifying its position as a prominent player in the industry.
Author’s Calculations
Analyzing the company’s past financial performance, we witnessed a remarkable surge from $58 billion in 2020 to a staggering $170 billion in 2021. This substantial growth was predominantly driven by robust sales figures in China.
In China, Dongfeng Peugeot Citroën Automobile Co. Ltd [DPCA], more than doubled its annual sales volume of 2020 with 100,000 units sold and Stellantis became the fourth largest Independent After Market (IAM) parts distributor in China with sales growth of approximately 30% year on year.
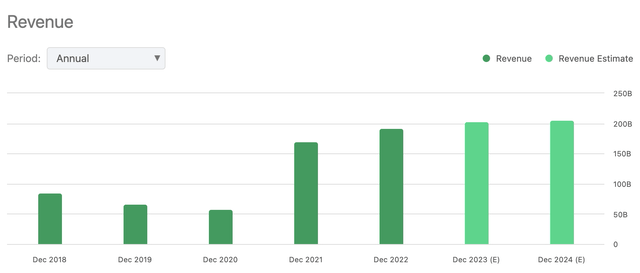
Revenue Expectations (Seeking Alpha)
However, a pertinent question arises: can Stellantis sustain its impressive revenue of over $200 billion? Is it vulnerable to a potential sales decline? The answer seems to be somewhat nuanced. While demand for vehicles has remained stable since the peak in April, S&P anticipates a slight dip in demand for October 2023. In my view, car demand may decrease at some point, especially when people are facing financial difficulties and higher interest rates. For this reason, I’ve included a scenario in the “Risks to Thesis” section where you will observe that Stellantis remains undervalued even if its sales were to decline by 50%.
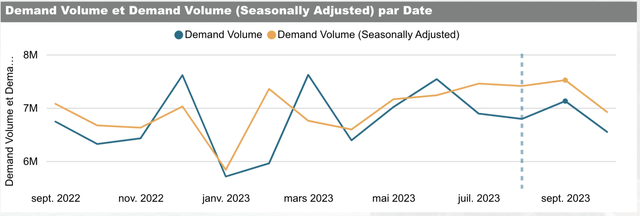
S&P
Finally, something important for the future is that Stellantis has strategically shifted its focus towards commercial vehicles, constituting a substantial 30% of the company’s overall sales. Commercial trucks typically necessitate replacement around the decade mark, given their rigorous usage, requiring increased maintenance that can amount to as much as $15,000 annually. Should owners neglect these vital maintenance procedures, it often results in the need for a new vehicle, however, they usually change their fleet every 3-5 years, for a good trade-in value.
Market
As anticipated, the passenger vehicle market is poised for more conservative growth compared to the commercial vehicle sector. This discrepancy arises from the fact that companies possess greater purchasing power and a more frequent need for vehicle replacements, a contrast to families who typically do not engage in car turnover every 3-5 years. Additionally, it’s essential to note that not every individual incurs maintenance costs exceeding $10,000 annually.
Interestingly, the COVID-19 pandemic triggered an exceptional shift, with affluent Americans exhibiting heightened interest in car purchases, particularly SUVs. This preference aligns with the better profit margins these vehicles offer to automakers.
Nonetheless, the passenger car market is projected to experience a gradual growth trajectory, with a Compound Annual Growth Rate [CAGR] of 1.73% from 2023 to 2027.
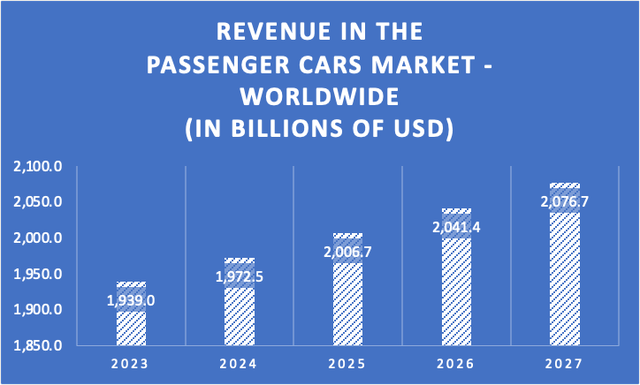
Author’s Calculations with base on Statista
The real surge, however, lies within the commercial vehicle segment, as previously mentioned. This market is expected to outpace the growth of passenger vehicles due to the more frequent replacement cycle adopted by companies. Anticipated growth in this sector is robust, with an impressive CAGR of 6.8%.
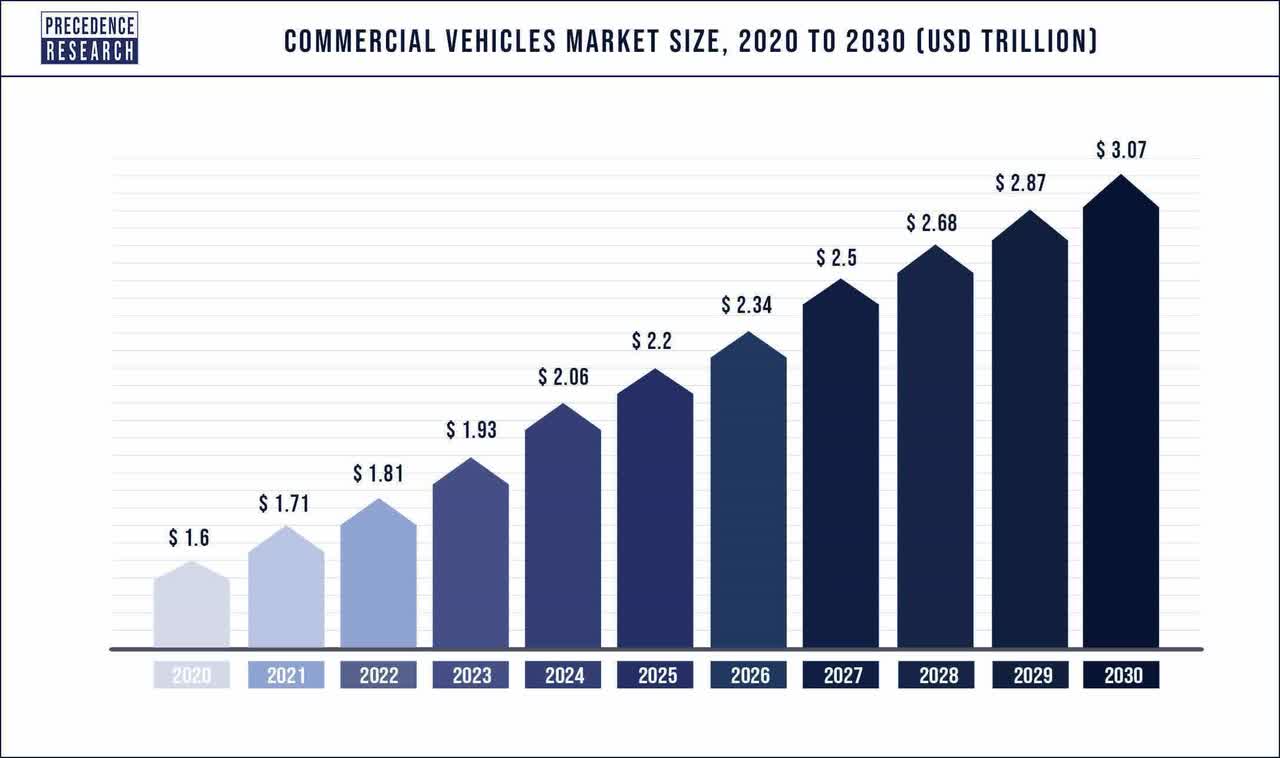
Precedence Research
UAW Strikes
The United Auto Workers [UAW] union initiated targeted strikes against the three major American auto companies, namely General Motors Company (GM), Ford Motor Company (F), and Stellantis, commencing on September 15. As of today, September 24, these strikes have persisted for a span of ten days.
The UAW’s primary demands encompass a 36% wage increase over a four-year period, a shift from 401K plans back to traditional pensions, cost-of-living raises [COLA] – a provision that remained in effect until 2008 when GM and Chrysler underwent bankruptcy proceedings – elimination of the two-tier wage disparity, where employees hired before 2007 earn $33 per hour while their post-2007 counterparts earn $17 per hour, implementation of a 32-hour workweek with a 40-hour pay, and the revival of a retiree health-care plan.
Realistically, the UAW is unlikely to secure all of its demands. The probable outcomes may include wage hikes and COLA provisions. However, reinstating retiree healthcare and traditional pension plans may remain elusive due to the need for automakers to maintain financial flexibility, particularly in the event of an economic downturn. It’s worth noting that the UAW made concessions in 2008 to rescue companies like GM from bankruptcy. While Stellantis may currently have the capacity to meet these demands and maintain profitability, prudent financial management dictates having reserves for tougher times, as employees are not inclined to purchase shares to rescue the company. The distinguishing factor today is that, unlike 2008, when GM faced declining sales due to high gas prices, Stellantis has a product line that includes EVs, which are in demand.
As of 2022, Stellantis employed 43,000 UAW members. Complying with all of the UAW’s demands is estimated to cost $150 per hour per employee. This translates to an increase in expenditure from the existing $4.9 billion allocated for these UAW workers to a substantial $12.4 billion, signifying a $7.5 billion yearly escalation.
When assessing the net income of the three automakers (GM, Ford, and Stellantis), it becomes evident that Ford’s net income ($4.1 billion) would potentially face bankruptcy, GM ($10.2 billion) could experience a significant deficit, while Stellantis, with its robust $21 billion net income, emerges as the most resilient among them. This positions Stellantis as an attractive investment option when compared to the other two industry giants.
Financials (In millions of USD unless stated otherwise)
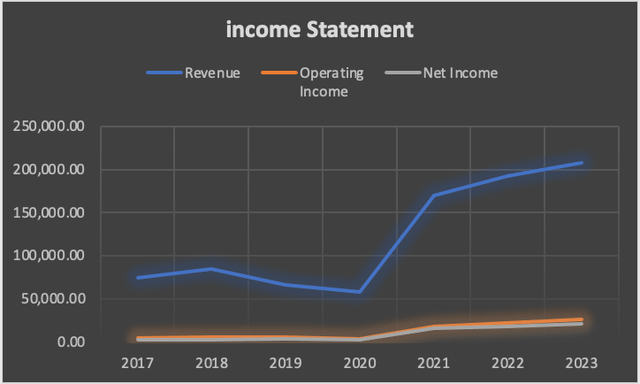
It’s worth highlighting that Stellantis has achieved remarkable annual revenue growth of 25%, although it’s essential to acknowledge a recent slump in sales spanning from 2018 to 2020.
| Revenue | Operating Income | Net Income | |
| 2017 | 74,692.00 | 4,748.70 | 2,308 |
| 2018 | 84,805.00 | 6,225.20 | 3,239 |
| 2019 | 66,172.70 | 5,623.10 | 3,590.6 |
| 2020 | 58,216.50 | 4,138.80 | 2,655 |
| 2021 | 170,064.90 | 18,185.80 | 16,162 |
| 2022 | 192,303.20 | 22,534.50 | 17,988 |
| 2023 | 207,290 | 25,833 |
21,564 |
Author’s Calculations
In addition to this impressive revenue growth, Stellantis has witnessed an upswing in net income and operating margin since 2020, currently resting at 10.4% and 12.46%, respectively.
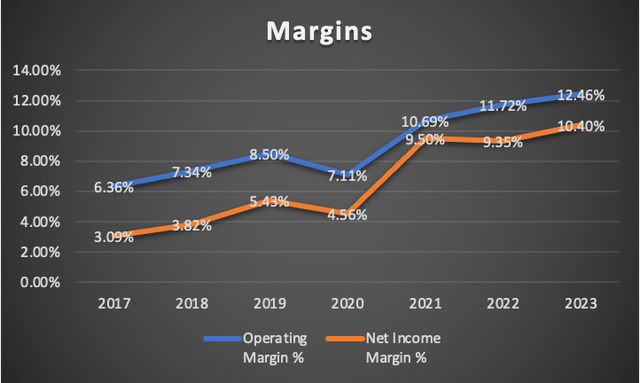
Author’s Calculations
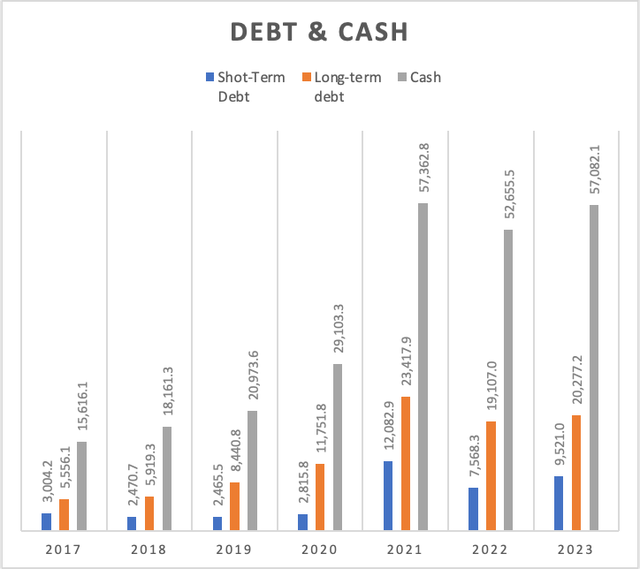
Stellantis finds itself in an enviable and highly resilient financial position. The company holds sufficient resources to entirely clear its existing debt, underscoring its exceptional management.
Author’s Calculations
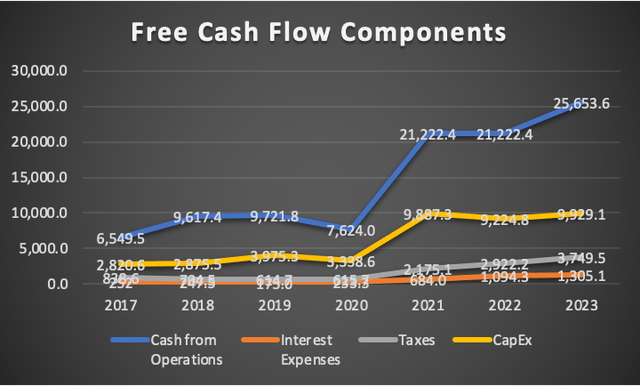
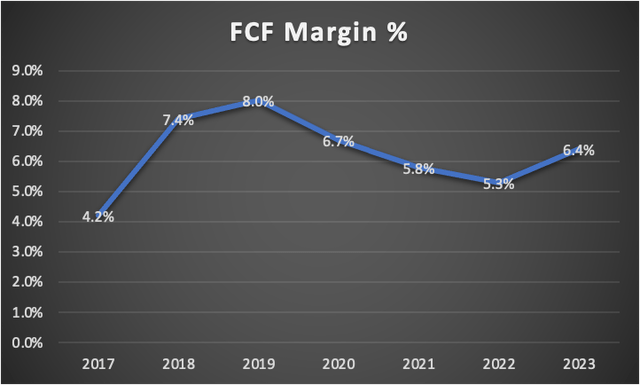
Now, let’s delve into the crucial aspect of free cash flow, which has seen a substantial increase attributed to a sharp rise in cash from operations, accompanied by proportional growth in capital expenditures [CapEx]. Despite being inherent to capital-intensive businesses, Stellantis maintains a commendable free cash flow margin, currently at 6.4%. While this figure is slightly lower than the 8% seen in 2019, it surpasses both Ford’s 3.7% and GM’s 5.2%.
Author’s Calculations
Author’s Calculations
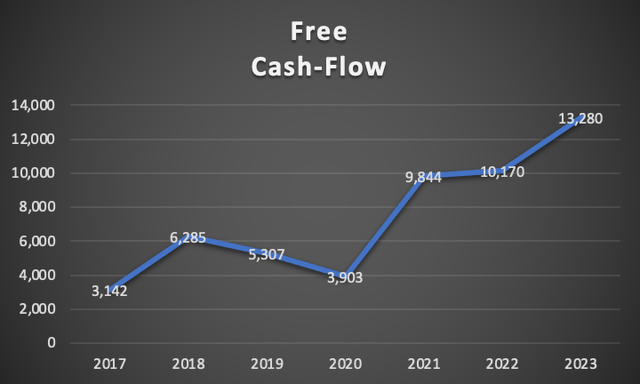
In the bigger picture, Stellantis has bolstered its free cash flow by an impressive 42% between 2017 and 2023. Presently, on a trailing twelve-month [TTM] basis, it stands at an impressive $13.2 billion. This robust free cash flow not only positions the company well for the long term but also enables it to address vehicle issues, invest in research and development (R&D), and secure its ability to consistently achieve over $200 billion in revenue.
Author’s Calculations
In sum, Stellantis, as an automaker, stands on a strong financial footing. As indicated in the forthcoming valuation section, it appears capable of accommodating the demands of UAW workers while maintaining high profitability. However, a potential concern could emerge if the UAW’s success sparks similar demands in other regions worldwide, such as Europe. Such a scenario could present a significant challenge to Stellantis.
Valuation (In millions of USD unless stated otherwise)
The first step in our valuation process centers on forecasting Stellantis’s revenue growth over a six-year horizon. To establish a baseline, we’ve drawn upon the projected revenues conveniently accessible within Stellantis’s ticker’s “Summary” section on Seeking Alpha.
According to these figures, analysts predict a modest revenue uptick of 1.48% between 2023 and 2024. In contrast, my own projections for the period extending from 2025 to 2028 are slightly more optimistic, envisioning a revenue growth rate of 1.68%.
| Revenue | Net Income | Plus Taxes | Plus D&A | Plus Interest | |
| 2023 | $202,640.00 | $11,753.12 | $13,493.97 | $18,843.59 | $20,122.86 |
| 2024 | $205,550.00 | $11,921.90 | $13,687.75 | $19,114.19 | $20,411.84 |
| 2025 | $210,577.75 | $12,213.51 | $14,022.55 | $19,581.72 | $20,911.11 |
| 2026 | $215,749.76 | $12,513.49 | $14,366.96 | $20,062.67 | $21,424.71 |
| 2027 | $221,070.77 | $12,822.10 | $14,721.29 | $20,557.47 | $21,953.10 |
| 2028 | $226,545.73 | $13,139.65 | $15,085.87 | $21,066.59 | $22,496.79 |
| ^Final EBITA^ |
To forecast this, I have employed the “expected market growth” rates mentioned in the “Overview” section, specifically under the “Market” segment. For passenger vehicles, I have incorporated a CAGR of 1.78%, while for commercial vehicles, I have utilized a CAGR of 4%. It’s important to note that commercial vehicles constitute approximately 30% of Stellantis’s total sales.
| Passenger | Commercial | Total | |
| 2025 | 146,446.2 | 64,131.6 | 210,577.8 |
| 2026 | 149,052.9 | 66,696.9 | 215,749.8 |
| 2027 | 151,706.0 | 69,364.7 | 221,070.8 |
| 2028 | 154,406.4 | 72,139.3 | 226,545.7 |
Subsequently, I projected Depreciation & Amortization (D&A) and Interest expenses using margins linked to revenue, at 2.64% and 0.63%, respectively. Following this, there is a table outlining the assumptions (the WACC is derived from here), followed by the Discounted Cash Flow [DCF] model, illustrating the entire process of discounting the projected cash flows.
| D&A Projection | Interest Projection | |
| 2023 | 5,349.621 | 1,279.27 |
| 2024 | 5,426.444 | 1,297.65 |
| 2025 | 5,559.175 | 1,329.39 |
| 2026 | 5,695.714 | 1,362.04 |
| 2027 | 5,836.187 | 1,395.63 |
| 2028 | 5,980.724 | 1,430.19 |
| TABLE OF ASSUMPTIONS | |
| (Current data) | |
| Assumptions Part 1 | |
| Equity Value | 84,094.30 |
| Debt Value | 32,171.50 |
| Cost of Debt | 4.06% |
| Tax Rate | 14.81% |
| 10y Treasury | 4.40% |
| Beta | 1.26 |
| Market Return | 10.50% |
| Cost of Equity | 12.09% |
| Assumptions Part 2 | |
| EBIT | 26,619.30 |
| Tax | (1,977.96) |
| D&A | 5,457.20 |
| CapEx | 9,929.10 |
| Capex Margin | 4.80% |
| Assumption Part 3 | |
| Net Income | 21,564.80 |
| Interest | 1,305.00 |
| Tax | 3,749.50 |
| D&A | 5,457.20 |
| Ebitda | 32,076.50 |
| D&A Margin | 2.64% |
| Interest Expense Margin | 0.63% |
| Revenue | 206,715.0 |
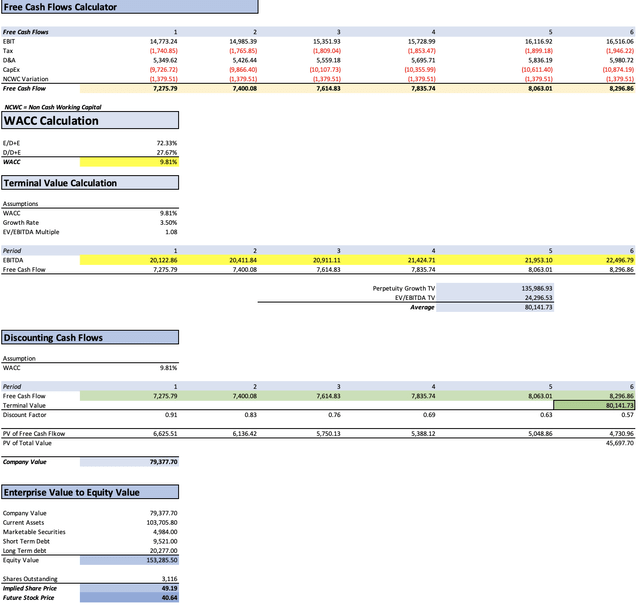
DCF 1 (Author’s Calculations)
The model suggests a current fair value per share of $49.19, reflecting an impressive 154% upside potential from the current stock price of $19.35. Furthermore, the future stock price projection of $40.64 indicates a 110% increase, translating to an annual return of 22%. These numbers strongly suggest that Stellantis is significantly undervalued. To validate this, I cross-checked with other sources and found that many analysts on Seeking Alpha provide target price ranges between $40 and $55, further corroborating the undervaluation hypothesis.
Risks to Thesis
The primary risk that warrants consideration revolves around the possibility of Stellantis agreeing to allocate the substantial sum of $7.5 billion to meet all the demands put forth by the UAW. This action might trigger a chain reaction, leading to additional strikes in regions like Europe, which could severely dent Stellantis’s financial stability. In such a scenario, there’s a likelihood that Stellantis may resort to reducing its U.S. workforce and outsourcing production to non-unionized areas. This could potentially impact product quality. It’s crucial to note, however, that Stellantis is unlikely to concede to all of the UAW’s demands, which may mitigate the risk.
Another noteworthy concern centers on the potential erosion of Stellantis’s competitive edge, including potential declines in product quality. Nevertheless, Stellantis enjoys a distinct advantage as the best-capitalized automaker among the big three, possessing the financial resources needed to address any such challenges effectively.
Finally, there is the risk of a sales downturn for Stellantis in the coming years, potentially spanning the next year and beyond. Such a development could render the remarkable revenues achieved in 2021-2022 as cyclical anomalies, potentially undermining the reliability of the DCF analysis. To account for this, let’s assume Stellantis’s revenue does indeed slump to $100 billion in 2024 and then grows at a rate of 1.65% thereafter until 2028. In this scenario, the fair value would be $35.85, representing an 85% upside and a 17% annual return. This indicates a substantial margin of safety.
Conclusion
In conclusion, the landscape for Stellantis, the automotive giant born of the merger between Fiat-Chrysler and Groupe PSA, appears promising and robust. With a diversified portfolio of iconic brands, ranging from Jeep to Maserati, Stellantis boasts a resilient financial position. Its remarkable annual revenue growth of 25% and a solid net income, operating margin, and free cash flow underscore its financial strength. Notably, the company’s savvy financial management has positioned it to potentially navigate through challenges such as labor disputes, ensuring its long-term viability and profitability.
However, it is not without its risks. The ongoing negotiations with the United Auto Workers [UAW] union pose a substantial short-term risk. Conceding to all of the UAW’s demands could lead to a cascade of strikes in other regions, potentially affecting product quality and financial stability. Stellantis must tread carefully, seeking a balance between satisfying employee demands and maintaining its competitive edge. Moreover, the risk of a sales slump in the coming years could test Stellantis’s resilience. Nevertheless, a prudent valuation analysis suggests significant upside potential, reflecting the company’s current undervaluation.
In the face of these challenges, Stellantis remains a strong contender in the automotive industry. Its solid financial foundation and strategic positioning make it an attractive investment option, with the potential for substantial returns. While risks persist, Stellantis’s ability to adapt and capitalize on market opportunities suggests a bright future for this automotive powerhouse.
Read the full article here