Written by Nick Ackerman, co-produced by Stanford Chemist.
Voya Infrastructure, Industrials and Materials Fund (NYSE:IDE) takes a unique approach to blend together its portfolio with three of these different sectors. The fund trades at a deep discount, which has actually widened out since our last coverage well over a year ago. The discount might be attractive, but the fund has generally been a weak performer over the long term, so it could be deserved.
That said, 2023 looks like, despite the infrastructure allocation within its utility sleeves, it’s having a relatively strong year. Utilities have been one of the sectors hardest hit by rising interest rates, causing higher yields and higher borrowing costs for financing their heavy CAPEX businesses.
The Basics
- 1-Year Z-score: -0.70
- Discount: -15.81%
- Distribution Yield: 9.50%
- Expense Ratio: 1.22%
- Leverage: N/A
- Managed Assets: $179.85 million
- Structure: Perpetual
IDE’s investment objective is “total return through a combination of current income, capital gains and capital appreciation.”
To achieve this, they will “invest primarily in companies in the infrastructure, industrials and materials sectors that will potentially benefit from building, renovation, expansion and utilization of infrastructure.” They continue more specifically that they “seek to build a diversified portfolio of equity securities of companies that may potentially benefit from spending in six areas: power, construction, materials, communications, transportation and water.”
The fund takes the approach of utilizing a call-writing strategy as well instead of taking on borrowings to potentially achieve its investment objective. Given the current rate of higher interest rate environments, that could be seen as a positive. In addition to that, the lower expected volatility could be desirable for some investors.
In implementing their overwriting strategy, they write against ETFs rather than individual holdings. They don’t always hold the ETF in the quantity or at all that they are writing against, so it technically sets them up to writing naked calls, which can result in unlimited losses in theory. However, in practice, they own an underlying portfolio that will at least loosely follow the movements of these broader ETFs. Here is a look for some context of the ETFs they had written against at the end of their last fiscal year.

IDE Short Call Option Positions (Voya)
They also limit their overwrite strategy to around 50%, with the latest percentage of portfolio assets being overwritten at 34.45%. One of the drawbacks of a call writing strategy is capping upside; with a lower overwrite strategy, they are still leaving plenty of the portfolio open to a potential rally. However, historically, the terms “rally” and “IDE” haven’t generally been used in the same sentence due to their relatively weak historical performance.
Deep Discount Persists
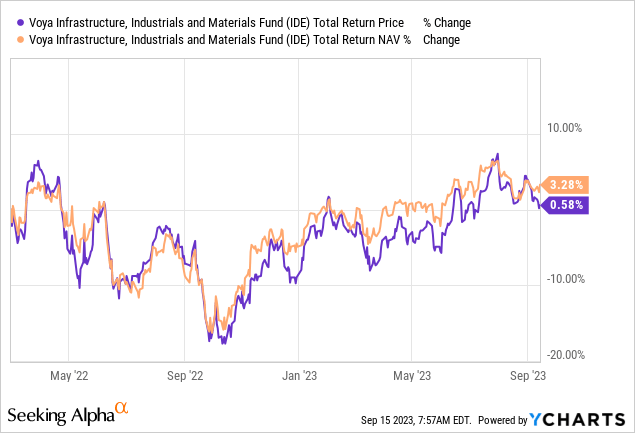
Thanks to holding up better than the broader market in 2022 and having a decent 2023, the fund has produced a total return that has only been slightly below that of the S&P 500 Index since our last update. This is a fairly arbitrary timeframe, but it gives a look at roughly a year and a half of performance. While the S&P 500 Index isn’t a great benchmark overall, it can give us some relative context of how the fund has performed relative to what could be considered the equity asset class.
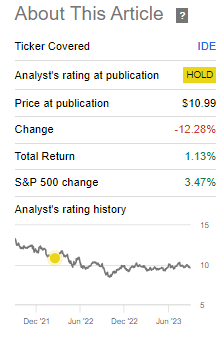
IDE Performance Since Last Update (Seeking Alpha)
Since the discount had widened since our last update, the fund’s NAV performance in this period would have meant it was even a touch higher. Although the actual share price itself had fallen, the distribution had made up for the drop, which should always be factored in for something that pays such a high distribution yield. The returns will generally be 100% provided for by the distribution. In fact, that’s the only thing that has produced a return for IDE over the longer run, as the NAV and share price have only declined historically.
Ycharts
This brings us to one of the other issues with IDE: the fund has been a weaker performer over the longer term. There isn’t a great peer group to put IDE in with. The fund includes the MSCI All Country World Index as its “reference index,” which isn’t focused on infrastructure but only on “global developed and emerging markets.” This is why they also state that it isn’t benchmarked to that index, but it just helps provide some comparable results against a basket of global securities.
That said, most would probably put it up against other infrastructure funds such as Cohen & Steers Infrastructure Fund (UTF) and Reaves Utility Income Fund (UTG). The longer-term results from those funds have been crushing IDE. UTF and UTG are weighted more toward utilities and are leveraged funds, so they have some key differences.
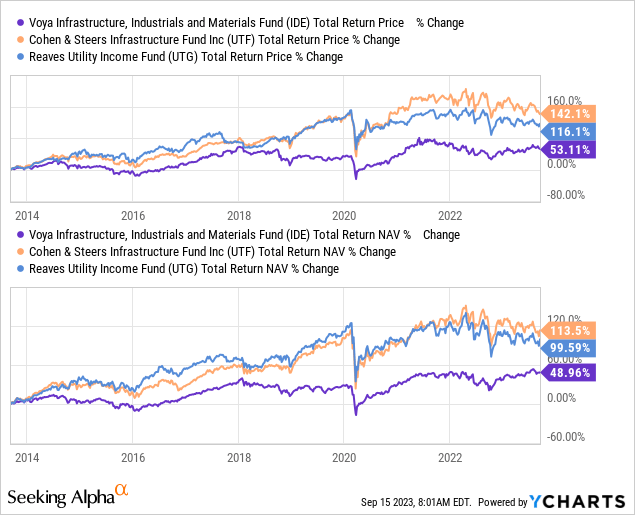
Ycharts
For those interested, IDE has been having a much better year this year, though, through 2023. That’s where the tilt towards a more utility-oriented portfolio and leverage could be hurting these funds.
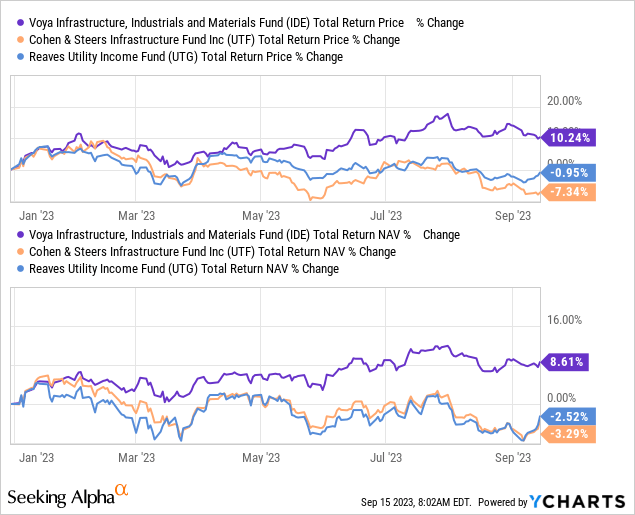
Ycharts
So if one believes that the recent fortunes of IDE have turned around, IDE could be the better fund to pick up here as it offers a much more attractive discount relative to these two other ‘peers.’ After all, the more recent performance of the fund has been much more promising than its longer-term track record. It could be time that IDE is actually turning around its luck.

IDE Annualized Performance (Voya)
Another fund that also isn’t leveraged that could be worth considering that’s invested in the infrastructure and industrial space is the abrdn Global Infrastructure Income Fund (ASGI). On a YTD basis, ASGI and IDE were performing similarly before IDE started pulling away. We can’t look at a long decade period of performance comparison because ASGI didn’t launch until 2020.
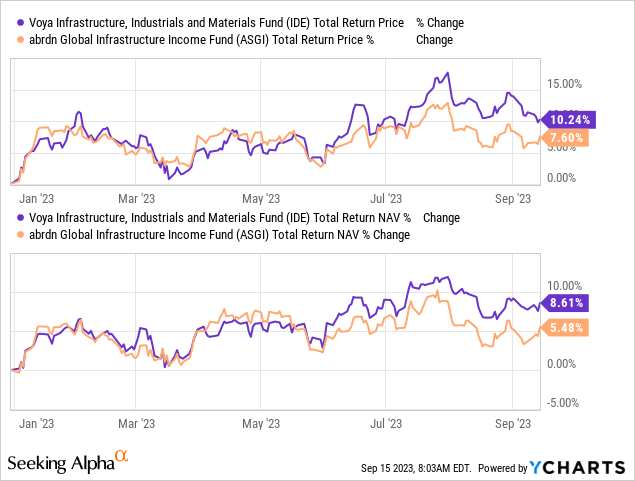
Ycharts
ASGI offers a similar deep discount that IDE does at this time, and that’s part of what makes both of these funds relatively attractive alongside not being leveraged in this current environment. IDE has offered investors a deep discount plenty of times, and there appears to be a pattern. Considering the fund at this time could make a lot of sense for investors who like the underlying portfolio, as we appear to be in the latest discount trough.
At the very least, we are looking at the fund being about as heavily discounted as it has ever been in the last decade, excluding the sharp drop during Covid. That doesn’t mean that a discount can’t get wider, but historically speaking, it at least indicates that the chances are for a decreasing discount rather than an expanding one.
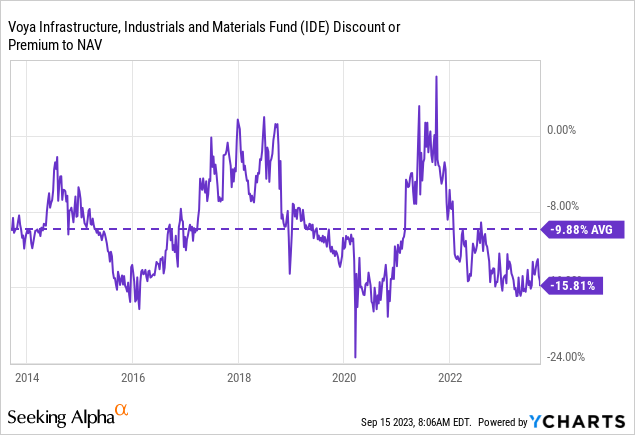
Ycharts
Deep Discount ‘Boosts’ Distribution Rate
Another factor to consider when it comes to investing in closed-end funds with deep discounts is how the distribution rate is impacted. In this case, it is looking quite tempting at a distribution rate of 9.5% as that’s materially above the NAV rate of 8% currently. Meaning that the fund has to earn a lot less than investors are actually receiving.
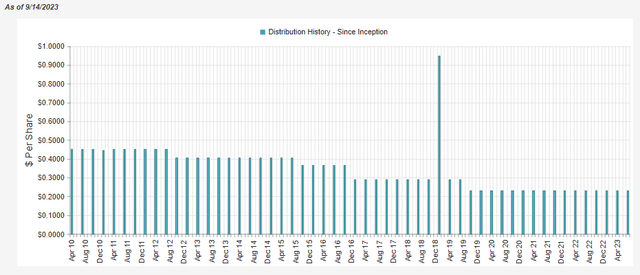
IDE Distribution History (CEFConnect)
However, that’s where IDE’s more ugly historical performance can come back to provide some caution once again, as they hadn’t been able to earn that. Therefore, that has led to cuts along the way and while performance more recently is promising, it’s hard to look past the gloomier long-term track record. CEF investors also tend to favor monthly distributions over the quarterly pay schedule. So that could play out in seeing the fund trade at a relatively larger discount as well.
In the last fiscal year and even the year before that, the fund provided some net investment income to cover their distribution. However, like all equity funds, they will still require capital gains. NII coverage in fiscal 2023 came to 25%. The fund had also repurchased some shares last year and conducted a tender offer in the previous year, so the total distributions paid out decreased, but NII increased. That’s another good sign for the fund.
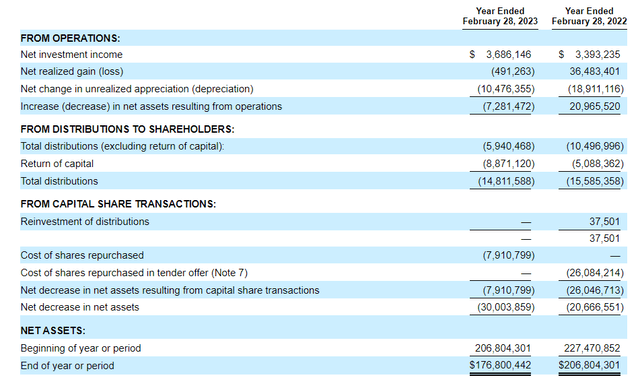
IDE Annual Report (Voya)
One of the ways to help generate some capital gains would be through the fund’s option writing strategy. However, as of their 2023 fiscal year-end report, the fund generated losses of $272,053 as the result of written options. That was in addition to realizing losses on the fund’s underlying holdings and some losses on its foreign currency-related transaction.
While the fund held up relatively well in 2022, the fund was still subject to unrealized depreciation as well. So, overall, last year, nothing really worked for the fund, but it was able to thwart the lows that the broader market had experienced.

IDE Realized/Unrealized Gains/Losses (Voya)
For tax purposes, the fund has seen classifications across the spectrum of ordinary income, capital gains and return of capital for the last two years. Given the fund’s performance, it’s more surprising that it wasn’t mostly return of capital distributions.

IDE Distribution Tax Classifications (Voya)
When we did our last update, we looked at the 2020 and 2019 tax classifications, and both saw higher characterizations of ROC distributions more heavily than the last two years. That could make it more appropriate for a taxable account, but these ROC distributions would generally be considered destructive as the NAV has slid lower.
IDE’s Portfolio
Turnover in the fund was fairly high in the last fiscal year at 72%. That was only topped in fiscal 2019 when it touched 78%, but it has been as low as 23%, which occurred in fiscal 2018.
The fund carries a fair bit of exposure to each asset class, but the positioning they’ve taken more recently has favored electric utilities. However, industrial and chemical positions have also played an important role in the fund. This makes sense as most utility performance through 2023 has been fairly weak, as utilities are the worst-performing sector.
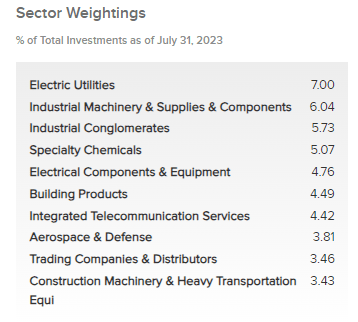
IDE Sector Weighting (Voya)
It’s also important to consider that this fund isn’t afraid to invest internationally where they believe the best values are to be found. This could have also been a big reason why the fund had underperformed more historically relative to other infrastructure funds, though UTF also has a global presence and hasn’t performed as poorly.
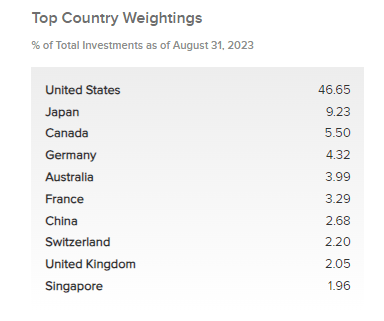
IDE Geographic Exposure (Voya)
Interestingly, despite the relatively high turnover in the fund and not having covered IDE in an update since February of 2022, the positioning of the fund isn’t all that different. In our prior update, electric utilities had a 6.46% weighting and were the largest exposure at that time, too. That was followed by integrated telecommunication services at a weighing of 6.36%, which had slipped to 4.42% more recently.
Given the close weightings of each sector, perhaps that isn’t too surprising at all, but the geographic allocations have also remained fairly static. U.S. exposure was 43.99%, followed by Japan at 9.19% and Canada at 5.5%.
Another characteristic of the fund from last year to this year is that Cisco Systems (CSCO) remains the largest position in the fund. It’s at roughly the same weighting, too, as it was previously 2.29%. CSCO probably would be more closely defined as a tech company, but in this case, it would appear they are looking at it from the communications infrastructure or equipment angle.
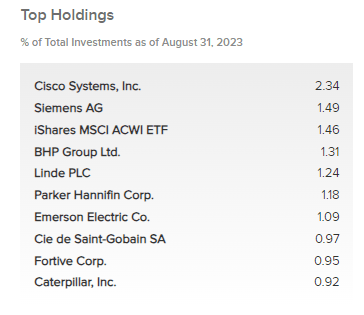
IDE Top Ten Holdings (Voya)
Beyond CSCO, there are only a couple of other repeated holdings that we saw early in 2022, such as the iShares MSCI ACWI ETF (ACWI) and BHP Group (BHP). Otherwise, the other top holdings have all been replaced, either consciously by management or by normal market gyrations. The weightings between each position are fairly similar, so it wouldn’t take too much in terms of underlying movements to see holdings shake up within the top ten positionings.
Conclusion
This fund remains one that I still remain on the fence and would give a ‘Hold’ rating, though the discount is certainly getting tempting. The fund regularly trades at a deep discount of nearly 10%, but there have been some wild fluctuations over the last decade, and we appear to be in the trough more recently. Even further, we’ve already seen the fund has performed better more recently than what some could consider peers. Though IDE is quite unique, finding an exact peer isn’t really possible. So, admittedly, I could be being too harsh on IDE for its longer-term historical troubles rather than the more optimistic merits it is sporting right now.
Read the full article here


Leave a Reply