Investment Thesis
Hallador Energy (NASDAQ:HNRG) demonstrates strong financial health, indicated by a low leverage ratio of 0.94 and a debt reduction of $11 million in six months. High coal prices have boosted operating revenues by 73% compared to last year, and the company’s strategic increase in coal inventory prepares it for rising energy demands. Its EBITDA growth rate of 426.6% stands out among its industry peers, justifying its higher EV/LTM EBITDA multiple range of 4.3x to 4.7x. This multiple implies an enterprise value between $657 million and $726 million, indicating an undervalued stock with an upside potential of 10.3% to 23.7%. Hallador’s 179.9% half-yearly revenue growth and diversification into Electric Operations suggest a positive long-term outlook. The company also maintains a focus on debt repayment, as indicated by a debt paydown yield of 6.89%. Considering the balanced risk-reward profile, the recommendation is a ‘Buy’ for long-term, moderately aggressive investors.
Overview
In Q2 2023, Hallador Energy generated $16.9 million in the second quarter and $39 million in the first half of the year. This indicates that the company is profitable. The Earnings Per Share (EPS) was $0.51 for basic and $0.47 for diluted in the second quarter. Over the first six months, these figures stand at $1.18 for basic EPS and $1.08 for diluted EPS, reinforcing profitability.
Another significant metric is Adjusted EBITDA, which was $35.3 million for the quarter and $69.3 million for the first half of the year. The company’s bank debt decreased by $1 million in Q2 and $11 million over six months, effectively enhancing its financial health. The leverage ratio is at a low-risk level of 0.94.
When it comes to its core business of coal, Hallador Energy is making strategic gains. Their coal shipments are priced high, and they’ve significantly ramped up their coal inventories. This gives them the flexibility to meet increased power demands, showing adaptability and foresight. Their average sales price for coal was $65.44 per ton in the second quarter, while their costs stood at just over $41 per ton, thanks largely to inflation. This contributed to a margin of $23.92 per ton before elimination and is backed by the fact that 1.7 million tons of coal were shipped at this price. The company saw a 73% increase in operating revenues from coal compared to the same quarter last year, fueled mainly by these high coal prices.
Hallador increased its coal inventory by $2 million, which is planned to be shipped to Hallador Power for generating more MWh in H2 2023. About 80% of the output from the Merom Power Plant is now available for open-market sales since June 2023.
The company also secured a new credit facility that boosted their liquidity to $56.9 million, ensuring they have quick cash on hand. Their funded bank debt as of June 30th was $74.2 million, and they had $11.2 million in letters of credit. Their net funded bank debt was $71.9 million, showing they have managed their finances efficiently.
In the energy sector, the prices of WTI and Brent Crude oils have significantly risen, but there’s a caveat. High oil prices are beginning to decrease demand, affecting sectors like gasoline and airlines. However, the company has managed their financial health robustly and even with external market conditions, they are set to withstand volatility.
Hallador’s Debt-to-EBITDA ratio of less than 1X and liquidity of $56.9 million signify lower investment risk and financial stability. Future contracted coal revenue stands at $230.40 million for 2023, $174.76 million for 2024, and $65 million for 2025, providing revenue predictability. The main risk is the production cost, which increased by $2.71 per ton from Q1 2023 to Q2 2023. The risk of increased production costs requires strategic pricing adjustments to maintain profitability.
To summarize, the company’s solid financial performance, low debt, and strategic moves in the coal business indicate not just present profitability but also a promising future.
Revenue Analysis

Author analysis
The Coal Operations had a 73% quarter-on-quarter (QoQ) growth for Q2 2023, jumping from $65.3 million to $113.1 million. The numbers for the first half of the year (H1) show a 69% increase, going from $123.6 million to $208.37 million. Electric Operations has already contributed $163.59 million for H1 2023, indicating successful diversification. This diversification could be a game-changer, more so given the global shift towards renewable energy, positioning Hallador Energy for a potentially stable future revenue stream. On the flip side, Corporate and Other revenues shrank by $23.6 million, but this could be attributed to resource allocation for the growth in Coal and Electric Operations.
Capital expenditures in Coal Operations increased from $13.8 million to $14.45 million for Q2, and from $22.9 million to $27.08 million for H1. This indicates a reinvestment into the business, which is generally a good sign for growth and operational maintenance. Additionally, assets in Coal Operations rose from $367.7 million last year to $387.6 million this year, with Electric Operations bringing in fresh assets worth $216.6 million. These assets are crucial as they are the backbone for generating future revenues.
Looking ahead, the company’s diversification into Electric Operations and steady revenue and income growth in Coal Operations imply a positive future outlook. The growth isn’t just short-term; there are indicators of potential long-term stability, too.
The company’s total revenue increased from $65.9 million in Q2 2022 to $161.2 million in Q2 2023, representing a robust 144.5% growth. It maintained this upward trajectory on a half-yearly basis as well, growing from $124.8 million in H1 2022 to $349.5 million in H1 2023, marking a 179.9% increase. This growth suggests not only a strong market demand for Hallador’s offerings but also could point to successful diversification into new revenue streams.
In terms of trends, the company shows a consistent increase in total revenue and income from operations over the last four quarters. There doesn’t appear to be any significant seasonality or cyclicality affecting these numbers.
On the operational efficiency front, the company turned its operating loss of $0.81 million in Q2 2022 into a gain of $22.2M in Q2 2023. This kind of turnaround in just one year is a strong indicator of improving operational efficiencies, which could subsequently enhance net margins if the trend continues. However, it’s essential to temper this optimism with a look at the rising interest expenses. These went up from $2.3M in Q2 2022 to $3.5M in Q2 2023, a jump of 51.4%. If revenue growth doesn’t keep pace with this increase, it could erode the company’s profitability. Additionally, if global interest rates rise, the company may find it more costly to service its debt, which could impact its financial stability.
On the quality of earnings, these are primarily derived from core operations rather than one-time events, which adds credibility to Hallador’s financial stability. In the forward-looking analysis, the company seems well-positioned for future financial growth, thanks to strong revenue growth rates and consistent operational income.
Turning to the forecast for the next year, we can make projections based on past growth rates. If the total revenue grows by around 50%, we’re looking at a figure close to $524.3M by the end of H1 2024. Assuming operating expenses increase at a rate of 30%, that would take them to about $323.6M. Subtracting this from the projected revenue gives us an income from operations of around $200.7M. If interest expenses continue to grow at the same rate, they could reach about $9.7M, leaving us with a net income before taxes of approximately $191M. If tax rates stay consistent, the net income could be about $186.1M. Finally, with no share dilution, the diluted EPS could be around $5.07.
In summary, Hallador Energy’s financial performance is promising but not without caveats. The company has shown remarkable growth in both revenue and operational income, but this has been accompanied by increasing operating expenses.
Balance Sheet Analysis
As of June 2023, the current ratio stood at 0.634, a jump from 0.578 in December 2022. Thus, the company has improved its ability to cover its short-term liabilities with short-term assets, from $138,519k to $112,702k in assets against liabilities that fell from $239,602k to $177,764k.
The quick ratio is 0.364, slightly dropping from 0.370 in December 2022. These numbers show that when you remove inventory, which isn’t as easily converted to cash, the company is less efficient in meeting its short-term obligations. Specifically, after deducting inventory of $47,945k in June 2023 and $49,796k in December 2022, the company’s ability to quickly turn assets into cash has slightly weakened. Based on the current ratio of 0.634, liquidity could be a concern.
In June 2023, the debt-to-equity ratio improved to 1.354 from a higher 1.932 in December 2022. In numbers, total liabilities went down from $415,530k to $345,007k, while stockholders’ equity rose from $215,024k to $254,882k. This shows that the company has reduced its reliance on debt, lowering its financial risk. The company has reduced its short-term debts from $33 million to $17.6 million, which is positive. However, long-term debt has increased slightly from $49.7 million to $54.7 million. The debt-to-equity ratio of 1.354 suggests that solvency is better managed.
Moving on to “Trend Analysis,” the numbers show both assets and liabilities are contracting. Comparing June 2023 to December 2022, total assets have decreased by 4.9%, while total liabilities have reduced by 16.9%, which indicates an overall contraction in the scale of operations. This contraction suggests that the company is strategically shrinking its scale.
As for “Forward-Looking Analysis,” the improvement in the Debt to Equity ratio suggests that the company may continue reducing its debt-dependency. The decline in current assets, particularly cash, is worrying and might lead to liquidity issues if it continues. On the positive side, stockholders’ equity is on the rise, from $215,024k to $254,882k, indicating that the business could be retaining profits, which are generally favorable for shareholders.
Free Cash Flow Analysis
Author analysis
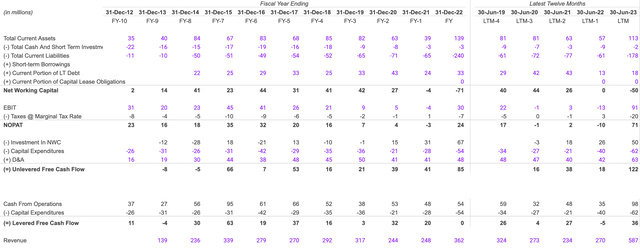
In 2019-2020, sales grew by 15.4%, rising from $234 million to $270 million. The next year, it increased to $587 million, marking a 117.4% increase. This surge suggests that the company has diversified its revenue streams by entering by successfully launching new products. The EBIT nosedived from $3 million to -$13 million in 2019-2020 but rebounded to $91 million in 2020-2021. This indicates changes in the company’s operational and pricing strategies.
The Net Working Capital declined from a positive $26 million to zero in 2019-2020 and further dropped to a negative $50 million in 2020-2021. This decline suggests liquidity issues; if the company doesn’t turn this around, it could struggle to meet short-term obligations. When we examine Unlevered Free Cash Flow, it fell from $38 million to $18 million in 2019-2020 but increased to $122 million the following year. This upswing could imply better operational efficiency.
Projecting forward, if the company maintains even a conservative 50% revenue growth, we could see it grow to approximately $939.2 million in 2024. Similarly, Unlevered Free Cash Flow could reach $183 million by 2024, assuming a 50% growth rate. These are cautious estimates grounded in the company’s recent performance. However, Net Working Capital remains a red flag; its negative trend could worsen the company’s liquidity if unchecked. Therefore, focusing on cash reserves and current liabilities will be critical.
In a nutshell, while the company shows promise in revenue and profitability, its financial management in areas like liquidity and working capital needs attention.
Shareholder Yield
Author analysis
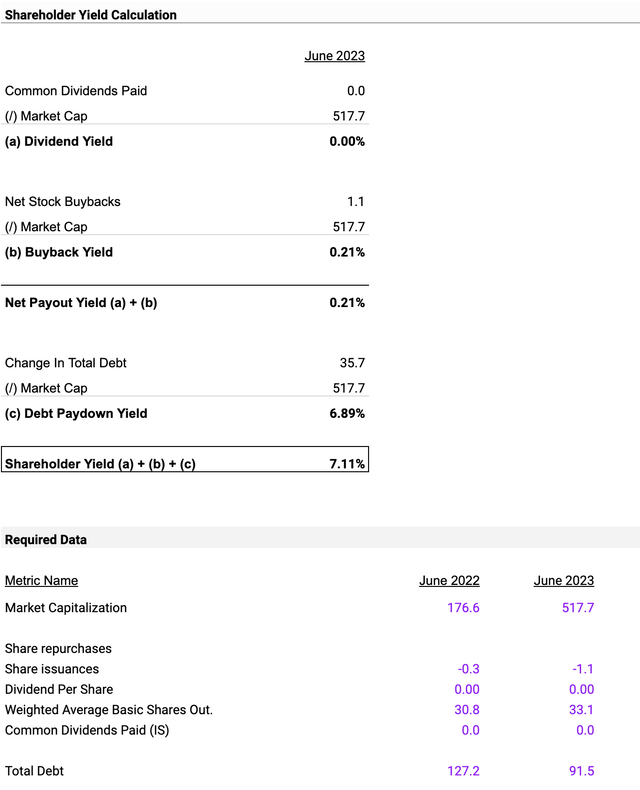
The net stock buybacks are modest, at $1.1 million, suggesting that the company is reinvesting its profits, as evidenced by a 0.00% dividend yield. The debt paydown yield is 6.89%, a key metric to watch because an increase in debt could seriously affect the company’s solvency. Currently, the change in total debt is $35.7 million. A buyback yield of 0.21% suggests minor stock repurchases. However, this needs to be juxtaposed with a debt paydown yield of 6.89%, which indicates increasing levels of debt.
Forecasting for the next year under current trends and assuming market conditions remain stable, if the company manages its debt well, investor sentiment could push the market cap higher. A shareholder yield of 7.11% combines dividend yield, buyback yield, and debt paydown yield. Given the company’s current strategy of zero dividends and a focus on debt repayment, this figure could remain constant.
Lastly, external factors, particularly interest rate hikes, could severely impact the company due to its increasing debt. This is a significant risk that needs to be constantly monitored.
Valuation
In conducting a comparable valuation based on the EV/EBITDA multiple, we’ve considered a range of benchmark companies within the same industry.

Author analysis
These companies are Natural Resource Partners L.P. (NRP), Alliance Resource Partners, L.P. (ARLP), Peabody Energy Corporation (BTU), CONSOL Energy Inc. (CEIX), Altex Industries, Inc. (OTCQB:ALTX), and Hallador Energy Company. The rationale for their inclusion is their similar business models and market capitalizations, which make them suitable for a comparative valuation.
Select LTM EBITDA Multiple:
Author analysis
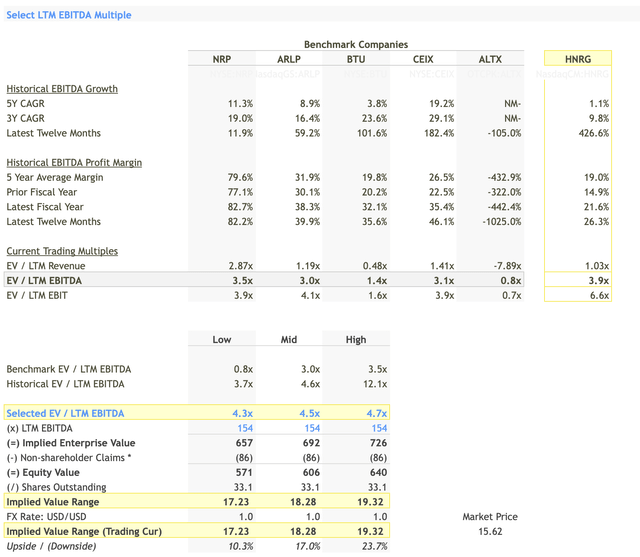
In the dataset, the LTM EBITDA multiples for benchmark companies range from a low of 0.8x (OTCQB:ALTX) to a high of 3.5x (NRP). For Hallador, the selected EV/LTM EBITDA multiple range is between 4.3x and 4.7x. Here’s why this range makes sense:
-
Historical EBITDA Growth: The company has an impressive LTM EBITDA growth rate of 426.6%. This is a clear outlier when compared to the benchmark companies, whose LTM growth rates range from -105.0% (OTCQB:ALTX) to 182.4% (CEIX). This extraordinary growth rate strongly justifies the company’s higher multiple.
-
Profit Margins: With an LTM EBITDA profit margin of 26.3%, the company is performing well compared to the five-year average margin of 19.0%. This indicates operational efficiency and justifies a higher multiple.
-
Market Comparison: Among the benchmark companies, the closest LTM EBITDA multiple is 3.5x (NRP), which has a 5-Year CAGR of 11.3% and a Latest Twelve Months growth of 11.9%. Despite these strong numbers, they are notably less impressive than those of Hallador, further substantiating the higher multiple.
-
Current Trading Multiples: The company is trading at an EV / LTM Revenue of 1.03x and an EV / LTM EBIT of 6.6x. Both these figures are in line with or higher than the industry benchmarks, further reinforcing that a higher LTM EBITDA multiple is warranted.
Implied Enterprise Value & Equity Value:
Using the selected LTM EBITDA multiple of 4.3x to 4.7x and an LTM EBITDA of $154 million, the implied enterprise value ranges from $657 million to $726 million. After deducting non-shareholder claims of $86 million, the implied equity value is between $571 million and $640 million.
-
Implied Stock Price: Given 33.1 million shares outstanding, the implied stock price ranges from $17.23 to $19.32.
-
Upside/Downside: Compared to the current market price of $15.62, this suggests an upside of 10.3% to 23.7%.
Select Projected EBITDA Multiple:
Author analysis
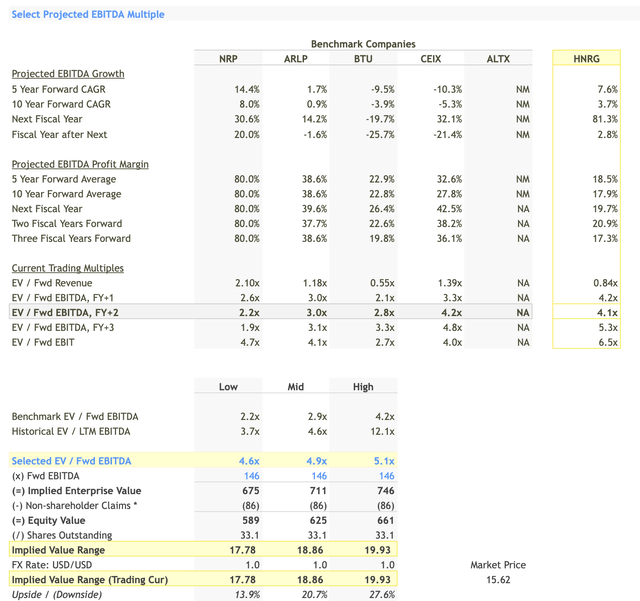
For projected EBITDA multiples, the benchmarks provide a range from a low of 2.2x to a high of 4.2x. Our selected EV/Fwd EBITDA multiple range for the company is between 4.6x and 5.1x.
Let’s break down the rationale behind selecting this range:
-
Growth Rates: The subject company has a 5-Year Forward CAGR of 14.4% and a 10-Year Forward CAGR of 8.0%. These are robust figures compared to some benchmark companies like BTU and CEIX, which have negative projected growth rates. This high growth rate justifies a higher multiple.
-
Profit Margins: The projected EBITDA profit margin for the next fiscal year is 50.0%. This is notably higher than all the benchmark companies, justifying the selection of a higher projected EBITDA multiple.
-
Risk Assessment: Given that the subject company has a fairly robust growth rate and high-profit margins expected, the risk associated with future earnings is relatively low, justifying the higher multiple.
Fair Value Range:

Author analysis
The fair value range is calculated using both the LTM EBITDA and Projected EBITDA methods. Based on the Projected EBITDA multiple range of 4.6x to 5.1x, and using the forward EBITDA figure of $146 million, the implied enterprise value ranges from $675 million to $746 million. After accounting for non-shareholder claims of $86 million, the equity value ranges from $589 million to $661 million.
-
Implied Stock Price: The implied stock price, based on these equity values and 33.1 million shares outstanding, ranges from $17.78 to $19.93.
-
Upside/Downside: Compared to the current market price of $15.62, this represents an upside of 13.9% to 27.6%.
-
Confluence with LTM Method: It’s worth noting that the fair value range using the projected EBITDA method closely aligns with that of the LTM EBITDA method, adding an extra layer of confidence in the valuation.
Conclusion and Investment Recommendation:
Based on the calculations, the fair value range of the stock is between $17.51 and $19.63, representing an upside of 12.1% to 25.6% from the current market price of $15.62. Since the upside potential is significant and considering that we have used both LTM and Forward EBITDA methods for a more comprehensive valuation, the recommendation would be to ‘Buy’ the stock. This ‘Buy’ decision is based on the growth rates, profit margins, and multiples that are either in line with or better than industry benchmarks, thereby providing a balanced risk-reward profile for the investor.
Read the full article here




Leave a Reply