H.B. Fuller (NYSE:FUL) has recently experienced a slight pullback in price due to recent earnings misses. Although the price has declined, I am of the opinion that H.B. Fuller is currently at a “hold” position. Despite the firm maintaining a well-managed level of leverage on its balance sheet and employing a robust acquisition strategy, the present valuation appears slightly elevated based on the assumptions in my discounted cash flow analysis.
Business Overview
The H.B. Fuller Company and its affiliates are experts in the creation, manufacture, and international distribution of a wide variety of chemical products, such as tapes, encapsulants, coatings, adhesives, sealants, and specialty additives. Engineering adhesives, construction adhesives, and hygiene, health, and consumable adhesives make up the company’s three main business segments. The Hygiene, Health, and Consumable Adhesives division focuses on developing and offering specialty industrial adhesives designed for a range of markets, including corrugated packaging, consumer goods, medical apparel, and health and beauty products.
With a wide range of adhesive materials created for various purposes, the Engineering Adhesives business serves markets ranging from appliances, electronics, and aerospace to medical devices. This segment is dedicated to developing high-performance industrial adhesives. The construction adhesives section, which serves both the consumer and professional markets, provides a range of products necessary for installing tiles, commercial roofing, HVAC systems, and insulation applications. In order to ensure widespread accessibility to its extensive variety of offers, H.B. Fuller advertises its products through direct channels in addition to distributors and merchants.
H.B. Fuller
Financials
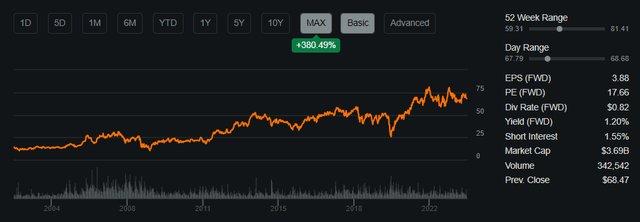
H.B. Fuller holds a market capitalization of approximately $3.69 billion, accompanied by a fair Return on Invested Capital of 6%. Presently, the stock is trading at $67.95 per share, slightly lower than its 200-day moving average of $69.55. Notably, the company’s GAAP Price-to-Earnings ratio stands at 24.22, surpassing that of its comparable companies, suggesting a potential state of relative overvaluation, as further elaborated in the valuation section of this analysis.
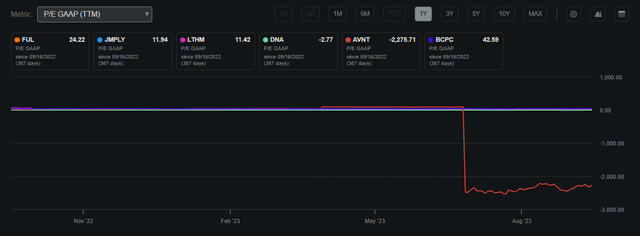
H.B. Fuller P/E GAAP Compared to Peers (Seeking Alpha)
The company also allocates an annual dividend of $0.82, equivalent to a 1.2% yield for shareholders, showcasing a prudent payout ratio of 21.63%. This indicates H.B. Fuller’s dedication to delivering value through various channels, including regular income, all while ensuring sufficient Free Cash Flow to sustain and expand its operations.
This approach allows H.B. Fuller to harness its 6% Return on Invested Capital to leverage growth and outperform competitors, demonstrating superior performance while utilizing minimal FCF. Consequently, this strategy facilitates long-term compounded value creation for shareholders.
Share Performance (Seeking Alpha)
Earnings
In H.B. Fuller’s most recent Q2 2023 earnings report, the company fell short of both revenue and profit expectations. The earnings per share was missed by $0.11, registering at $0.93, while revenues lagged by $71.42 million, amounting to $898.24 million, marking a YoY decline of -9.6%. This discrepancy highlights the challenge H.B. Fuller faces due to macroeconomic pressures, particularly heightened inflation causing reduced customer inventory.
However, despite these headwinds, there’s a positive aspect seen in the EBITDA, which increased by 190 basis points to reach 15.9% YoY. This upward trend showcases the company’s capability to generate sufficient cash flow, acting as a buffer against these challenges and paving the way for robust growth. Additionally, an encouraging factor from the recent earnings is the ongoing optimism among analysts regarding future performance, with projections indicating a swift recovery in both EPS and revenues.
Looking ahead, it’s crucial to closely monitor CPI data and anticipate potential rate hikes by the Fed. These factors will significantly influence leveraging opportunities and sales in the short term, providing a clearer perspective on the company’s future performance.
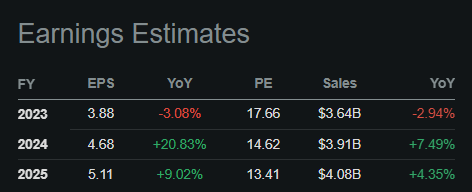
Earnings Estimates (Seeking Alpha)
Performance Compared to the Broader Market
For the last two decades, H.B. Fuller has consistently matched the performance of the S&P 500, factoring in dividends. This underscores the company’s capacity to create value for shareholders by not only fostering growth within its core business but also through annual dividend payouts.
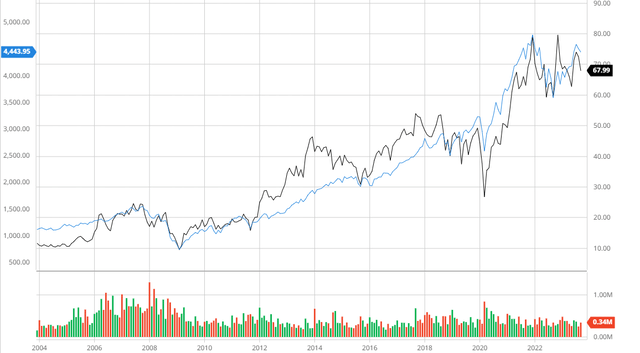
H.B. Fuller Compared to the S&P 500 20Y (Created by author using Bar Charts)
Analyst Consensus
In the recent three-month period, analysts have designated H.B. Fuller as a “buy”. Their 1-year price target of $81.33 suggests a potential upside of 19.63%. This showcases the analysts’ confidence in the anticipated recovery of performance in the coming year. However, it’s important to note that these ratings might shift if macroeconomic challenges intensify.

Analyst Consensus (Trading View)
Balance Sheet
H.B. Fuller’s current balance sheet adequately balances leverage and safety to stimulate further growth through the use of debt while also leaving room to leverage in times of uncertainty. With debt declining 20% over the past 5 years and interest coverage being at 4.03, H.B. Fuller’s financial position seems relatively sound in a high-rate environment. The firm also holds a fair Current Ratio of 1.99 and an Altman-Z-Score of 2.45, indicating the firm has adequate liquidity to remain solvent in the medium term.

Financial Position (Alpha Spread)

Interest Coverage (Alpha Spread)

Solvency Ratios (Alpha Spread)
Valuation
Before finding an accurate fair value for H.B. Fuller, I decided finding an appropriate discount rate would be prudent. Assuming a risk-free rate of 4.34% based on the 10-year treasury yield, I have calculated a Cost of Equity of 8.56%.

Cost of Equity (Created by author using Alpha Spread)
Assuming the previous Cost of Equity calculation, I was able to find a WACC of 7.04% which is below the industry average of 9.89%.

WACC Calculation (Created by author using Alpha Spread)
Applying a discount rate of 8.56% and considering revenue and margin growth aligned with analyst projections, H.B. Fuller appears to be overvalued by approximately 8%, presenting a fair value of $62.67. This fair value was determined utilizing a 5-year Equity Model DCF based on Net Income.
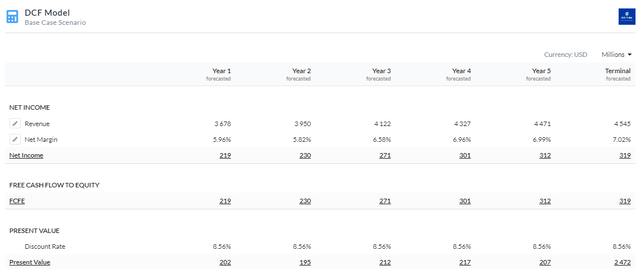
5Y Equity Model DCF Using Net Income (Created by author using Alpha Spread)

Capital Structure (Created by author using Alpha Spread)
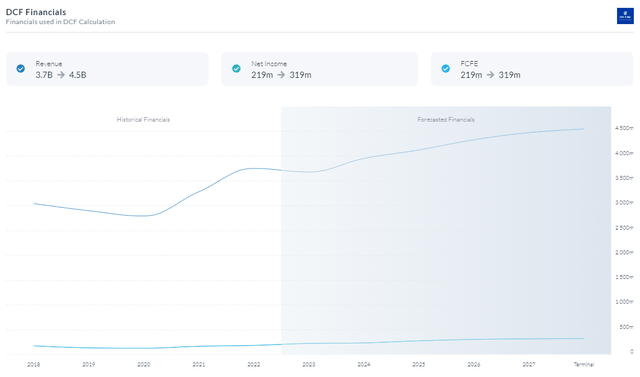
DCF Financials (Created by author using Alpha Spread)
Strategic Acquisitions Resulting in Compounding Growth
H.B. Fuller uses a proactive acquisition approach to strengthen its product line, increase its market presence, and acquire a competitive edge. A significant instance of this tactic is the 2017 purchase of Royal Adhesives & Sealants. The addition of a wide variety of specialty adhesives and sealants to H.B. Fuller’s portfolio through this acquisition greatly improved its position in important markets. H.B. Fuller’s skills were complimented by Royal Adhesives & Sealants’ strong position in sectors like packaging, construction, and aerospace.
By uniting the knowledge and resources of the two companies, H.B. Fuller was able to offer a wider variety of solutions to its clients, enter new markets, and create synergies. The acquisition also strengthened H.B. Fuller’s position as a key player in the adhesives and sealants sector by demonstrating the company’s dedication to seeking out development opportunities and using inorganic means to achieve its strategic goals.
I anticipate that the company will adeptly deploy Free Cash Flow and leverage synergies within its core operations to surpass competitors in terms of price and quality. This approach will lead to cumulative growth across various segments of the company, ensuring a steady stream of cash flows in the future.
Risks
Economic Volatility and Market Demand Fluctuations: Economic downturns or shifts in consumer demand, particularly in important industries like the automobile and construction, can have a significant impact on H.B. Fuller’s sales and overall revenue.
Raw Material Price Fluctuations: Chemical and petrochemical prices can change as a result of a variety of circumstances, including disruptions in supply, geopolitical events, or changes in consumer demand. The production costs of the business may change as a result of these variances.
Conclusion
In summary, I am of the opinion that H.B. Fuller is currently at a “hold” position. Despite the firm maintaining a well-managed level of leverage on its balance sheet and employing a robust acquisition strategy, the present valuation appears slightly elevated based on the assumptions in my discounted cash flow analysis.
Read the full article here


Leave a Reply