Research Brief
In today’s analysis, I will be covering Goldman Sachs (GS), which is in the financials sector, and investment banking /brokerage subsector.
Since my last rating in May where I rated it a buy, the share price climbed 0.38%.
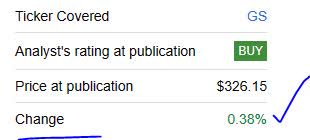
Goldman Sachs – performance since last rating (Seeking Alpha)
The company had its most recent quarterly earnings result on July 19th, and that will be the reference data used in some parts of today’s analysis. Using my updated, more detailed research methodology, I will determine if my prior rating of 3 months ago stands, should be upgraded or downgraded.
For readers less familiar with this company, some relevant points to mention from their website are: roots go back to 1869, headquartered in New York City, trades on the NYSE, offers broad range of solutions to companies / other financial institutions / governments / individuals.
Goldman is also listed by Wikipedia as #5 in their largest banks in the US, and included in the Financial Stability Board‘s 2022 list of global systematically important banks.
A few key peers of this company include Charles Schwab (SCHW) and Morgan Stanley (MS).
Research Methodology
To determine a holistic rating for this stock of buy, sell, or hold, I split my research into the following 5 categories: dividends, valuation, share price, earnings growth, capital strength.
Each category has equal weight. If I recommend the stock in at least 4 of 5 categories, it gets a buy rating. 3 out of 5 will get a hold rating, and below that earns a sell rating.
This process is aimed to simplify things, focus on financial fundamentals, and to analyze an equity from multiple angles.
Dividends
In this category, I will discuss whether this stock should be recommended for dividend-income investors, by analyzing official dividend data from Seeking Alpha.
As of the writing of this article, the forward dividend yield is 3.36%, with a payout of $2.75 per share on a quarterly basis. No ex dates are coming up soon.
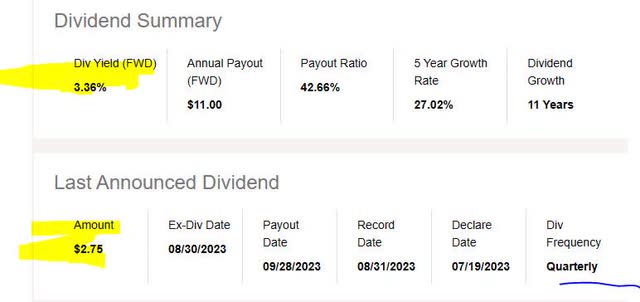
Goldman Sachs – dividend yield (Seeking Alpha)
In comparing the yield vs the sector average, this stock is below the sector average by almost 12%. I think that could be a moderate negative to think about for the dividend investor in terms of this stock vs the overall sector it is in, although yield is not the only component to dividends.
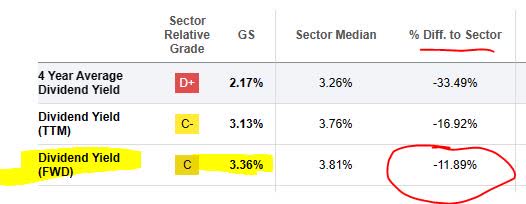
Goldman Sachs – dividend yield vs sector average (Seeking Alpha)
Important to mention, for example, in comparing the current dividend to the last 5 years, this company has been on a steady uptrend when it comes to dividend growth. I think this is also a positive for dividend investors as it points to the historical capacity of this company to return capital back to shareholders, though not necessarily a guarantee of future dividends.
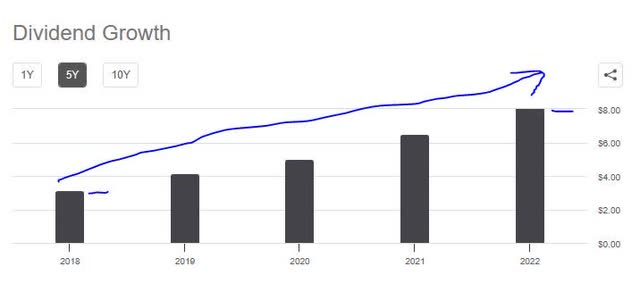
Goldman Sachs – dividend 5 year growth (Seeking Alpha)
Based on the evidence found, I would recommend this stock in the category of dividends. In the section on share price later on, I will show how annual dividend income can play a role in putting together my investment idea for this stock.
Valuation
In this category, I will discuss whether this stock presents an attractive valuation for my readers. To analyze this, I will use today’s valuation data from Seeking Alpha and specifically the forward P/E ratio and forward P/B ratio.
This stock’s forward P/E ratio is 12.61, which is 29% above the sector average that is hovering closer to 9.8x forward earnings. I am looking for a valuation in a range that is up to 30% below the average or in line with it and up to 5% above average. In this case, in my opinion this stock is not reasonably valued on price-to-earnings but moderately overvalued, as I like this valuation no more than 10x earnings.
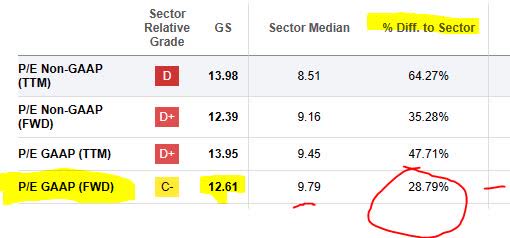
Goldman Sachs – P/E ratio (Seeking Alpha)
This stock’s forward P/B ratio is 1.03, which is 1.84% above the sector average that is hovering around 1x forward book value. My benchmark is a valuation in a range that is up to 30% below the average or in line with it and up to 5% above the average. In this case, this stock is reasonably valued I think as it is only slightly above the average on price-to-book value.

Goldman Sachs – P/B ratio (Seeking Alpha)
To compare against individual peers I mentioned earlier, let’s take Schwab for example. Its current valuation is a forward P/E that is 110% above the average and a P/B of 190% above average.
Similarly, Morgan Stanley has a forward P/E that is 47% above the sector and a forward P/B that is 49% above average.
Compared to these two peers, I think Goldman is much more reasonably valued on those two ratios.
Since this stock is reasonably valued on one of the two ratios, but also more reasonably valued against two key peers on both ratios, I would therefore recommend it in the category of valuation, based on the evidence researched.
Share Price
In this category, I will decide if the current share price presents a value buying opportunity or not.
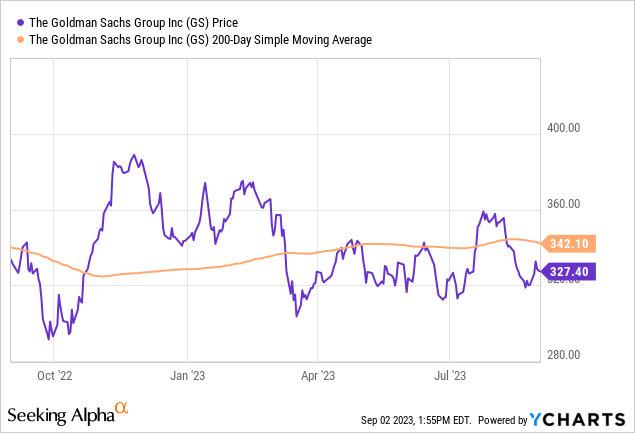
First, I pulled the most recent yChart as of this article writing. It shows a share price of $327.40 and compares it to its 200-day simple moving average “SMA” of $342.10, tracked over the last year. *Note: this chart below is not real-time so please be aware of the day/time in the chart, as market prices can fluctuate widely during a trading day.
To simulate my investing idea: I buy 10 shares at current share price, hold 1 year to earn a full year of dividend income, then sell in Aug. 2024 to achieve capital gains. A goal of +10% return on capital is my target.
At the same time, I established a risk tolerance to anticipate capital loss as well, so a negative -10% return is also tested. The following spreadsheet describes this idea:

Goldman Sachs – investing simulation (author analysis)
In the above test, the first sell price is +10% above the current 200-day SMA, and the 2nd price is -10% below the current SMA.
The first scenario exceeded my goal for return on capital as it achieves an 18.30% return after a year, and the 2nd sell scenario stayed within my risk tolerance for negative return since it actually achieved a negative return of -2.60%. Note that the potential capital loss is offset by the dividend income.
Because the two trading simulations met my profit goal and remained within risk tolerance, I would recommend the current share price as a buying opportunity, considering it priced just right.
This investing idea, however, may not fit all investors’ portfolio goals or risk tolerance, and should only be considered an oversimplified way to think about this stock as a long-term investment and in terms of potential gains as well as potential losses that could occur. Also, though I don’t get into tax topics here, note that two potential tax events could occur in the above scenario: capital gains and dividend income.
Earnings Growth
In this category, I will analyze the earnings growth trend for this company over the last year, using data from the income statement on Seeking Alpha as well as the most recent company quarterly earnings release, presentation and commentary.
First, I want to highlight the situation with this firm’s net interest income, as I think it is relevant, given all the buzz about the high rate environment of the last year.
You can see in the table below how this rate environment benefitted the top-line interest revenue greatly, but also greatly impacted interest “expense” as well, so the “net” interest income actually fell on a YoY basis. This points to what I call the double-edged-sword of the current rate environment, and this firm is obviously not immune to that sword.
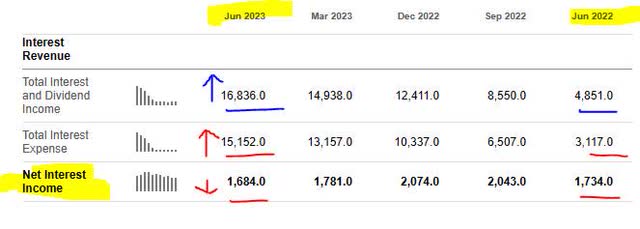
Goldman Sachs – net interest income (Seeking Alpha)
Also worthy to mention is the bottom line, which also saw a YoY drop compared to the same quarter a year ago. Though the firm is clearly profitable, it is the declining trend that is of modest concern to me, since after all I am considering multiple firms in this sector to invest in and so the income statement is one of the comparative factors, particularly performance over the last year.

Goldman Sachs – net income YoY (Seeking Alpha)
To help make sense of the “why” behind these drops, I turned to the Q2 earnings commentary.
According to the firm,
The decrease compared with the second quarter of 2022 reflected lower net revenues in Global Banking & Markets and slightly lower net revenues in Asset & Wealth Management, partially offset by higher net revenues in Platform Solutions.
At its core this firm is a leader in the investment banking segment, so in that segment a major driver of business is mergers and acquisitions (M&A).
The firm spoke of “significantly lower net revenues in Advisory, reflecting a significant decline in industry-wide completed mergers and acquisitions transactions.”
Goldman also has a large wealth management shop, so that too has seen some earnings headwinds.
According to the firm, “the decrease compared with the second quarter of 2022 reflected significantly higher net losses in Equity investments, significantly lower Incentive fees and significantly lower net revenues in Debt investments.”
Based on the evidence, I would not recommend this stock in the category of earnings growth, and am waiting for better YoY results in Q3 and Q4.
Capital Strength
In this category, I will analyze the capital strength for this company using data from the company recent quarterly presentation and earnings release, that shows financial viability of this firm.
For starters, the firm is well above regulatory requirements with a CET1 ratio of 14.9%, and hovering near 15% for several quarters. Keep in mind the CET1 is a key metric in the global banking sector.
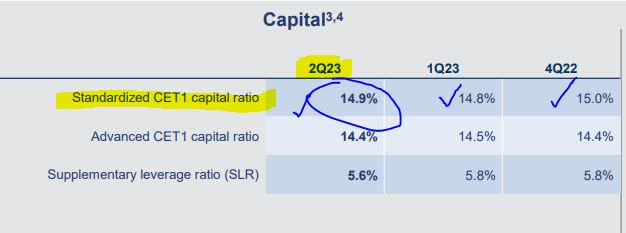
Goldman Sachs – CET1 ratio (company q2 presentation)
More signs of capital strength are a firm’s ability to return excess capital back to shareholders. Here is how that has looked at Goldman:
Returned $1.61B of capital to common shareholders during the quarter — 2.2MM common shares repurchased for a total cost of $750MM — $864MM of common stock dividends. Increased the quarterly dividend from $2.50 to $2.75 per common share in 3Q23.
Also vital to note since my last rating of this stock, was the result of the Fed stress test of top banks. A late June article in Barron’s highlighted that Goldman was also among the stocks that passed the test but also resulted in a bullish market response.
According to the article:
Goldman Sachs was the best performer in the Dow Jones Industrial Average on Thursday, jumping 3.1%. The stock was on pace for its largest percentage increase since November 2022.
The 23 largest banks in the U.S. passed the Fed’s annual stress tests, and while none were expected to fail, the fact that there were no negative surprises is a general positive for the banking sector and financials.
Based on the evidence, I would recommend this stock in the category of capital strength.
Rating Score
Based on passing 4 of my 5 rating categories above, this stock earned a buy rating today, which maintains my same rating from May. This rating is in line with the consensus from analysts and more bullish than the quant system, as shown by the graphic below.
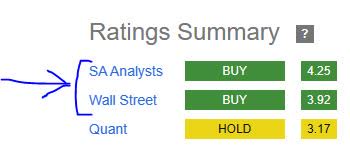
Goldman Sachs – rating consensus (Seeking Alpha)
Risk to my Outlook
My bullish outlook on this stock could be impacted by bearish investor & analyst sentiment driven by the latest fears of a bank’s exposure to commercial real estate (“CRE”) in its loan portfolio, and particularly office properties. Goldman also has a CRE portfolio as well, so this risk concern is relevant.
An August article in The Wall Street Journal highlighted some of this market concern:
Distress is continuing to build in commercial real estate as offices struggle with vacancies.
The overall delinquency rate for commercial mortgage-backed securities jumped 51 basis points to 4.41% in July, according to data provider Trepp. That is the highest rate since December 2021 and up from 3.06% 12 months ago.
The increase is being driven by pandemic-related shifts in work patterns that have led many companies to rethink their property footprints, which has led to skyrocketing vacancies and plummeting rents.
To examine this in relation to Goldman’s exposure, I think it best to understand what percentage vs the overall loan book is Goldman exposing itself to in terms of both CRE and office, but also if there are pertinent data points regarding bad debt.
This graphic will help:
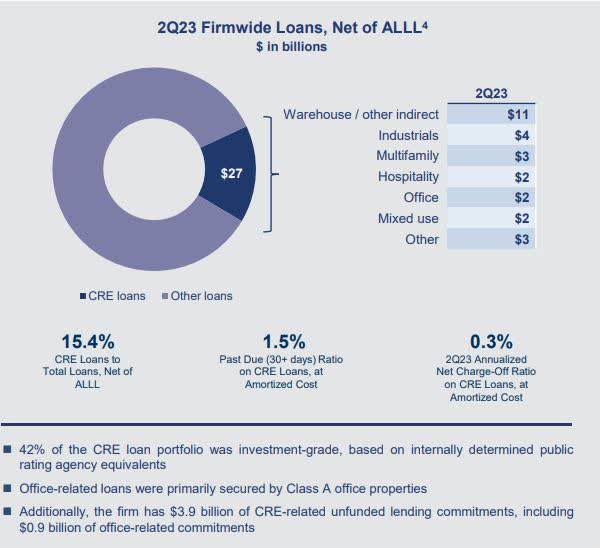
Goldman Sachs – CRE exposure (company q2 presentation)
It appears that CRE makes up only 15% of the overall loan book, and the ratios for past-due and net charge-offs remain under 2%. In addition, offices make up a smaller portion of the CRE book, with industrials / warehouse / multifamily taking up a much larger share of the book.
Based on the data, in my opinion this firm does not have office property exposure that would warrant being overly bearish on its stock, so I remain committed to my buy rating.
Analysis Summary
To wrap up today’s analysis, let’s go over the key points discussed:
This stock received a buy rating today, maintaining my rating from May. I am agreeing with the analyst consensus on this one but am being more bullish than the SA quant system.
Its positive points included: dividends, valuation, share price, capital strength.
Headwinds: earnings YoY growth was down.
The risk of exposure to office properties has been addressed and deemed to be minimal vs the overall picture.
Concluding Thoughts and Downside Risk:
Goldman, along with Morgan Stanley and Bank of New York Mellon (BK), remain on my watchlist of top-tier global banks due to their constant resiliency, systemically critical role in the financial sector, and continuing relatively strong financial fundamentals.
At the same time, readers should be aware of downside risk despite my bullish call.
I believe the downside risk could come from ratings agency downgrades of some of its banking peers, if not Goldman itself, and this could cause downward price pressure on stocks throughout this sector, if it continues.
Relevant to this is a CBS News article from Aug. 9th, where over 10 small to medium sized banks were downgraded by Moody’s. At the same time, some bigger banking names were “placed under review for possible downgrades” and that included Bank of New York Mellon and State Street (STT). Keep in mind these are two of the biggest “custodian” banks on the planet! Also, two relatively big banks with large consumer-focused businesses, Capital One (COF) and PNC Financial (PNC), were shifted from stable to negative outlook.
Although Goldman did not get dinged by Moody’s in this round it seems, it did get downgraded in late July by Citi, according to headlines in Barron’s and CNBC.
This is something readers should factor into their risk analysis, despite my bullish rating which remains.
Read the full article here


Leave a Reply