August in review
- Gold declined marginally by 1% in August, in the face of higher yields and a stronger dollar
- Sentiment remained weak for most of the month as ETFs continued to lose AUM while COMEX managed money net long futures positions fell to a five-month low.
Looking forward
- Since July, long-dated yields have risen faster than short-dated yields, meaning the yield curve is exhibiting a ‘bear steepening’, something often seen during a reflationary or early business cycle period
- While gold tends to underperform risk assets during these periods, it is not common to see bear steepening this late in the business cycle, and recent moves in yields may be masking other factors at play, such as higher risk premiums
- Soft US economic data suggests also that a slowdown is still likely, which, alongside a potential change in the shape of the yield curve, could signal an environment where gold has historically performed well.
Yields take centre stage
August was challenging for gold. After dipping below US$1,900/oz, it staged a late recovery – around the Fed’s Jackson Hole annual symposium – to finish the month down 1% at US$1,942/oz (Table 1).1 This slightly reversed July’s 3% gain and, in line with our expectations, bucked the historical trend of positive August returns.
Global gold ETFs saw another monthly outflow in August. Total AUM fell US$3bn (46t), with the majority coming from US-listed funds. COMEX managed money net long positioning declined to a five-month low before ending the month at 181t.2 OTC daily trading volumes remained elevated at US$143bn/day.
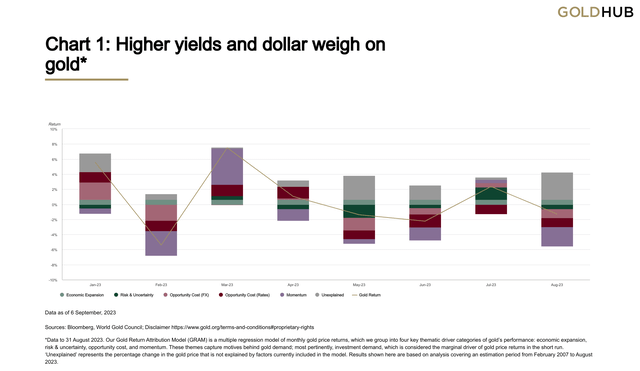
Our gold model GRAM suggests that changes in 10-year yields, the US dollar, and COMEX futures positioning were key headwinds for gold in August (Chart 1). US 10-year Treasury yields hit a 16-year high during the month,3 fuelled by rampant speculation over a possible Fed re-assessment of the US neutral rate. The growing expectation for ‘higher for longer’ rates (above 4%) is, in essence, a reflection of how persistent inflation and economic resilience continue to be. Dollar strength, meanwhile, was likely supported by concerns over China’s housing market as well as broad struggles in export-dependent currencies (such as Europe and China).
Gold found some support from the unexplained component of the model. As we have previously suggested, this could in part represent continued strength in central bank buying.
|
Sources: Bloomberg, World Gold Council; Disclaimer *Data to 31 August 2023. Our Gold Return Attribution Model (GRAM) is a multiple regression model of monthly gold price returns, which we group into four key thematic driver categories of gold’s performance: economic expansion, risk & uncertainty, opportunity cost, and momentum. These themes capture motives behind gold demand; most pertinently, investment demand, which is considered the marginal driver of gold price returns in the short run. ‘Unexplained’ represents the percentage change in the gold price that is not explained by factors currently included in the model. Results shown here are based on analysis covering an estimation period from February 2007 to August 2023. |
Table 1: Returns across currencies summary
Gold price and return in different periods across key currencies*
| USD (oz) | EUR (oz) | JPY (g) | GBP (oz) | CAD (oz) | CHF (oz) | INR (10g) | RMB (g) | TRY (oz) | AUD (oz) | |
| 31 Aug 2023 Price | 1,942 | 1,792 | 9,086 | 1,534 | 2,631 | 1,715 | 51,696 | 453 | 51,826 | 3,002 |
| August return | -1.4% | 0.1% | 0.9% | 0.1% | 1.4% | 0.1% | -0.8% | 0.2% | -2.3% | 2.4% |
| Y-T-D Return | 7.1% | 5.8% | 18.8% | 2.2% | 7.0% | 2.3% | 7.2% | 12.7% | 52.7% | 12.8% |
| *Data to 31 August 2023. Based on the LBMA Gold Price PM in USD, expressed in local currencies. Source: Bloomberg, ICE Benchmark Administration, World Gold Council |
Looking forward
- Recent changes in yields have led to a ‘bear steepening’ of the yield curve, historically a more challenging environment for risk-off assets such as gold
- But the expectation of a slowdown remains – a scenario in which gold has historically performed well.
Reading the curve
The US Treasury yield curve is arguably the most important financial indicator around, and its trajectory and shape are constantly under scrutiny. Most of the time (90%) it slopes upward as investors need to be compensated for lending their money for longer. 4 But at times, it inverts. As it has since July 2022, suggesting bond market participants have lapped up longer-dated Treasury bonds in anticipation of a dramatic economic and/or inflation slowdown as the ‘long and variable lags’ of monetary policy tightening kick in.
The bear awakens
Despite a pick-up in energy prices and some positive economic surprises, the evidence that we are very late in the business cycle, with growth and inflation slowing, still dominates.5 At this late stage one would typically expect any steepening of the yield curve to be the result of short rates dropping faster than long rates – i.e., a ‘bull steepener’.
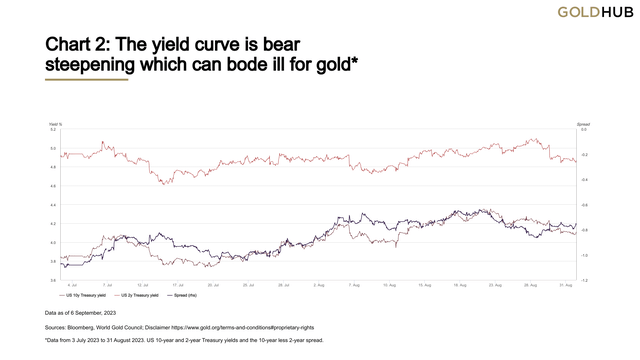
Instead, while the yield curve remains inverted, it experienced a fairly consistent ‘bear steepening’ from mid-July to mid-August,6 with long-dated rates rising faster than short rates (Chart 2).
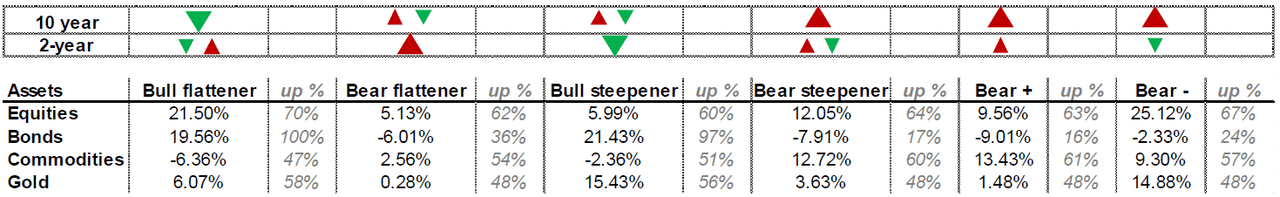
A bear steepener normally happens early in the business cycle or during a period of reflation. Bear steepeners tend to be bullish for risk assets and more challenging for hedge assets like gold, especially during ‘bear +’ periods (a subset of a bear steepener) where long and short rates are both rising together (Table 2).
|
Sources: Bloomberg, World Gold Council; Disclaimer *Data from 3 July 2023 to 31 August 2023. US 10-year and 2-year Treasury yields and the 10-year less 2-year spread. |
A noisy signal
Recent events suggest that the typical cyclical signal from the curve might be getting obscured by other factors:
1. A higher risk and term premium
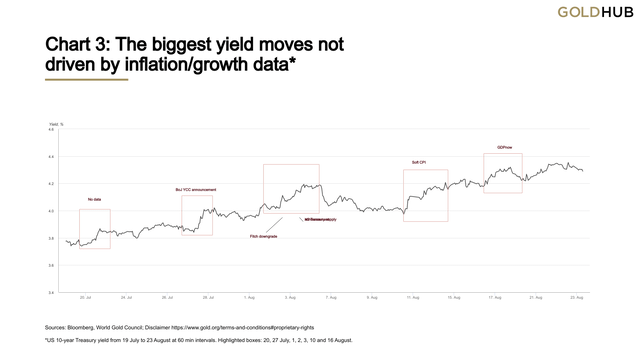
Chart 3 shows the intraday US 10-year bond yield since early July and the seven dates that explained most of the rise during this period. Only one of those days saw a meaningful growth/inflation data print – the Atlanta Fed GDPnow release for Q3 2023 at 5.8%. Yet, the yield retreated quite swiftly afterwards.
Had these yield surges been solely the result of higher growth or inflation expectations, we would probably have seen that reflected more in near-term policy rate expectations. But the terminal rate and the date of the first rate cut have barely budged since July. And while it’s true that policy rates further down the line have moved higher, we estimate their contribution to the 10-year rise at less than 50%.7
Table 2: Asset returns during various yield curve phases*
|
*Yield curve phases represented by 10-year less 2-year Treasury yield spread. The top two rows shows the dominant driver of the shift in the curve, represented by the larger arrow. The table below shows the annualised average returns for four major asset classes during each mutually exclusive phase, as well as the share of the phase returns that are up. The data is from Dec 1971 to July 2023 on a monthly frequency. Equities: MSCI world index, Bonds: US Government bond index, Commodities: BCOM index, and gold in US$/oz. Source: Bloomberg, World Gold Council |
|
Sources: Bloomberg, World Gold Council; Disclaimer *US 10-year Treasury yield from 19 July to 23 August at 60 min intervals. Highlighted boxes: 20, 27 July, 1, 2, 3, 10 and 16 August. |
On 2 August, the US Treasury announced US$1.9 trillion of issuance required to meet liabilities. It had prompted the ratings agency Fitch to downgrade US debt from its AAA rating to AA+ the day prior. While it has largely been dismissed as having little immediate bearing on bond markets, it has raised the narrative of ‘fiscal dominance’.8 This is particularly concerning as the federal budget deficit comes at a time when unemployment remains low.9
Alongside the expected bond supply increase, there are signs of demand fatigue as well: a lack of buyers at the 10 August auction saw 30-year bonds ending up in the hands of primary dealers.10
In addition, actual and expected sales of Treasuries by the two largest international holders –Japan and China – could be influencing sentiment. For example, the announcement by the Bank of Japan that it would raise its yield curve control (YCC) cap has made local JGBs more attractive relative to their US counterparts. And while there is little evidence of capital flowing back yet, the strength of the Japanese economy suggests they will only get more attractive.
2. Risk assets not following playbook
The cross-asset implications have not been typical either. While gold has played to the tune of the bear steepener, falling 2% since July 20th, equities and commodities have not. Global equities are down and commodities ex oil are flat. These assets don’t appear to be buying the risk-on story.11
What’s next
In summary, the move in the 10-year yield can likely be attributed to three main factors. A shift up in the ‘higher interest rates for longer’ narrative, supply and demand forces and a rise in the risk premium. The latter factor might start to provide support to gold prices, if it continues to increase.12
If we simply look at bear steepening, gold tends to underperform – with low single digit average returns. Historically, the most likely successor to a bear steepening is a bull flattening (approx. a third of the time).13 This is characterised by a fall in the long end of the curve relative to the short end, effectively an unwinding of the rising premia we’ve witnessed. This partly took place at the latter end of August with gold likely benefitting from such yield declines. Also, soft data continue to suggest that a slowdown is still firmly on the cards. This could result in either a bull steepening or a rare ‘bear-‘. Both phases have on average been gold friendly, yielding an annualised return of 15% – the highest of all the phases.
Regional insights
China: Local wholesale gold demand picked up – reflected by a 22% m/m rise in August’s average daily Au9999 trading volume. The rebound was mainly helped by the Chinese Valentine’s Day during the month, when retailers usually increase their promotional efforts. Upcoming major jewellery fairs in September also spurred replenishing activities. Gold ETFs attracted Chinese investors’ attention, adding 5t amid their downbeat sentiment on weaker-than-expected economic recoveries and lousy equity performances.
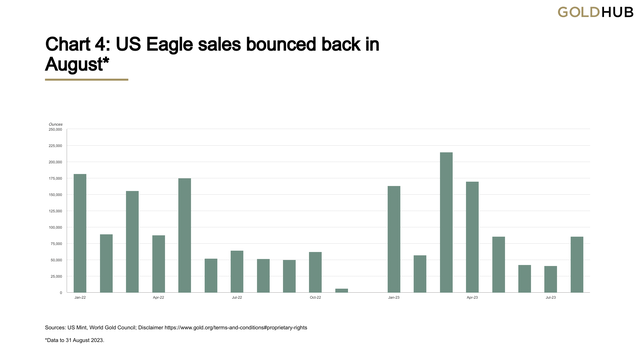
US: Remarks from Fed Chair Powell at Jackson Hole did little to steer market thinking in one direction or the other. Mixed macroeconomic data continues to support the ‘higher interest rates for longer’ narrative, which may have resulted in heavy gold ETF outflows, but the lagged effect of tighter policy to date cannot be ignored. US Eagle coin sales jumped to 85,500oz in August, the highest sales volume since May (Chart 4).
|
Sources: US Mint, World Gold Council; Disclaimer *Data to 31 August 2023. |
Europe: The economic outlook for the region continues to deteriorate, as manufacturing activity has fallen to levels not seen since the Global Financial Crisis. The European Central Bank faces a tricky balancing act in bringing inflation down – President Lagarde stated interest rates will stay high for “as long as necessary”14 – while not pushing the region’s economy into deeper trouble.
Central banks: Latest data available shows that global central banks added 55t to their gold reserves in July. The People’s Bank of China and the National Bank of Poland both added around 23t, while the Central Bank of Turkey was again among the buyers (17t). Qatar (3t), Singapore (2t) and the Czech Republic (2t) also bought gold. The Central Bank of Uzbekistan (11t) and the National Bank of Kazakhstan (4t) were the two noteworthy and familiar sellers in the month.
ETFs: Physically-backed gold ETFs15 experienced net outflows for the third straight month, losing US$3bn in August.16 Total AUM fell 3% to US$209bn whilst holdings saw a 46t decline, to 3,341t.
The majority of loss came from North American funds, extending their losing streak to three months. Europe also saw negative flows for the third consecutive month. But August’s outflow was markedly narrower than July’s US$1bn. In sharp contrast, Asian funds led global inflows, with China contributing the most (+US$293mn, +5t). Flows in the Other region were little changed, adding US$24mn.
Table 3: August gold ETF flows
Gold ETF holdings and flows by region*
| Total AUM (bn) | Fund Flows (US$mn) | Holdings (tonnes) | Demand (tonnes) | |
| North America | 105.1 | -2,676.10 | 1,683.70 | -44.2 |
| Europe | 91.9 | -314.7 | 1,471.10 | -8.2 |
| Asia | 8.4 | 429.8 | 127.8 | 6.6 |
| Other | 3.6 | 23.9 | 58 | 0.2 |
| Total | 209.1 | -2,537.20 | 3,340.60 | -45.6 |
| *Data to 31 August 2023. On Goldhub, see: Gold-backed ETF flows. Source: Bloomberg, Company Filings, ICE Benchmark Administration, World Gold Council |
Footnotes
Disclaimer: Important Information and Disclosures© 2023 World Gold Council. All rights reserved. World Gold Council and the Circle device are trademarks of the World Gold Council or its affiliates. All references to LBMA Gold Price are used with the permission of ICE Benchmark Administration Limited and have been provided for informational purposes only. ICE Benchmark Administration Limited accepts no liability or responsibility for the accuracy of the prices or the underlying product to which the prices may be referenced. Other content is the intellectual property of the respective third party and all rights are reserved to them. Reproduction or redistribution of any of this information is expressly prohibited without the prior written consent of World Gold Council or the appropriate copyright owners, except as specifically provided below. Information and statistics are copyright © and/or other intellectual property of the World Gold Council or its affiliates (collectively, “WGC”) or third-party providers identified herein. All rights of the respective owners are reserved. The use of the statistics in this information is permitted for the purposes of review and commentary (including media commentary) in line with fair industry practice, subject to the following two pre-conditions: (i) only limited extracts of data or analysis be used; and (ii) any and all use of these statistics is accompanied by a citation to World Gold Council and, where appropriate, to Metals Focus, Refinitiv GFMS or other identified copyright owners as their source. World Gold Council is affiliated with Metals Focus. WGC does not guarantee the accuracy or completeness of any information nor accepts responsibility for any losses or damages arising directly or indirectly from the use of this information. This information is for educational purposes only and by receiving this information, you agree with its intended purpose. Nothing contained herein is intended to constitute a recommendation, investment advice, or offer for the purchase or sale of gold, any gold-related products or services or any other products, services, securities, or financial instruments (collectively, “Services”). This information does not take into account any investment objectives, financial situation or particular needs of any particular person. Diversification does not guarantee any investment returns and does not eliminate the risk of loss. Past performance is not necessarily indicative of future results. The resulting performance of any investment outcomes that can be generated through allocation to gold are hypothetical in nature, may not reflect actual investment results and are not guarantees of future results. WGC does not guarantee or warranty any calculations and models used in any hypothetical portfolios or any outcomes resulting from any such use. Investors should discuss their individual circumstances with their appropriate investment professionals before making any decision regarding any Services or investments. This information contains forward-looking statements, such as statements which use the words “believes”, “expects”, “may”, or “suggests”, or similar terminology, which are based on current expectations and are subject to change. Forward-looking statements involve a number of risks and uncertainties. There can be no assurance that any forward-looking statements will be achieved. WGC assumes no responsibility for updating any forward-looking statements. Information regarding QaurumSM and the Gold Valuation Framework Note that the resulting performance of various investment outcomes that can generated through use of Qaurum, the Gold Valuation Framework and other information are hypothetical in nature, may not reflect actual investment results and are not guarantees of future results. WGC provides no warranty or guarantee regarding the functionality of the tool, including without limitation any projections, estimates or calculations. |
Original Post
Editor’s Note: The summary bullets for this article were chosen by Seeking Alpha editors.
Read the full article here