Intro
Fortune Brands Innovations, (NYSE:FBIN) is a major player in the home and security products industry. This company has two main segments. First, there’s the plumbing segment, which is worth $2.6 billion. They’re known for their Moen brand, and they sell faucets, showers, and other plumbing fixtures.
Then, there’s the outdoors and security segment, which is worth $2.2 billion. This part of the company is all about making sure our homes are safe and secure. They have products like entry doors under the Therma-Tru brand, patio decking under the Fiberon brand, and locks and other security devices under the Master Lock and SentrySafe brand names.
In this analysis, we’re going to dive deep into FBIN’s financial performance and its outlook for future growth. We’ll explore how the company makes money, how profitable it is, and how effectively it manages its cash flow. By gaining a better understanding of these areas, you’ll be in a stronger position to make an informed decision about whether investing in FBIN is a wise choice for you.
Track Record
We place a greater emphasis on a company’s historical financial performance compared to many other investors who may argue that past performance does not necessarily predict future outcomes. While this perspective has its merits, our stance is rooted in the belief that when we allocate our capital to a stock, we are essentially entrusting the company’s management with our funds, much like how investors trust a fund manager with their investments. Just as you wouldn’t consider investing with a fund manager without reviewing their past investment track record, why would you disregard a company’s historical performance when making an investment decision?
FBIN has demonstrated consistent growth in both revenue and free cash flow over the past decade albeit limited growth. We like investing in companyies that can at least double their revenue and free cash flow every ten years. We believe that over the long term a company’s share price will follow the direction of its revenue and free cash flow growth, therefore if a company is doubling these metrics over time then we can reasonably expect its share price to follow suit.
In terms of revenue, the company’s total growth from 2013 to 2022 amounted to approximately just 27.51%, with a compounded annual growth rate of about 2.46%, these results fall short of our doubling every ten years benchmark.
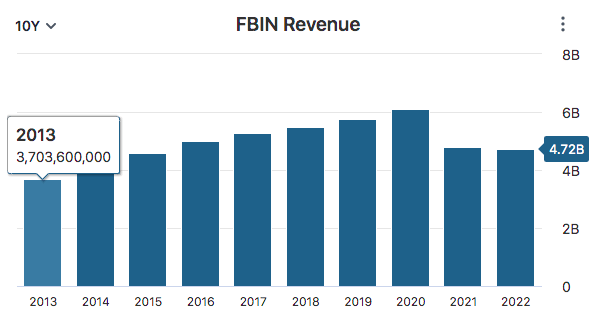
Data by Stock Analysis
Similarly, FBIN’s free cash flow has shown steady improvement, with a total growth of approximately 59.22% during the same period, and a CAGR of about 4.76%. Though the company’s free cash flow growth has improved over its revenue growth, we must admit that over a ten year period, we’d like to see more growth than FBIN has exhibited, as this mark also falls short of our previously mentioned benchmark.
Year-to-year fluctuations in a company’s free cash flow can be influenced by a multitude of challenging-to-predict factors. These may encompass economic conditions, cyclical and seasonal variations, unexpected costs and expenses, currency exchange rate fluctuations, regulatory shifts, market trends, geopolitical events (such as trade conflicts or actual wars), and even natural disasters. The unpredictability of these variables falls beyond our expertise.
In light of this uncertainty, our approach centers on comprehending a company’s underlying strengths and weaknesses. We seek to identify the factors that bestow upon a company a competitive edge, allowing it to consistently deliver satisfactory financial performance over the long term. By focusing on these fundamentals, we aim to mitigate the impact of external, unpredictable forces on our investment strategy.
We believe FBIN’s competitive advantage resides in its strong portfolio of leading brands across various product categories and many of these brands enjoy sustainable competitive advantages. For instance, Moen, recognized as America’s most trusted faucet brand for 80 years, has achieved a remarkable 98% awareness amongst designers in the United States. This recognition has translated into customer loyalty and solid market presence.
FBIN’s brand strategy focuses on innovation and differentiation. By shifting Moen’s brand positioning from plumbing to water experiences, it has seen a notable increase in consumer awareness, a 17-point rise in China alone. This innovative approach has opened up new opportunities and expanded market share. As you can see in the image below many of FBIN’s brands enjoy market leading positions within their respective categories.
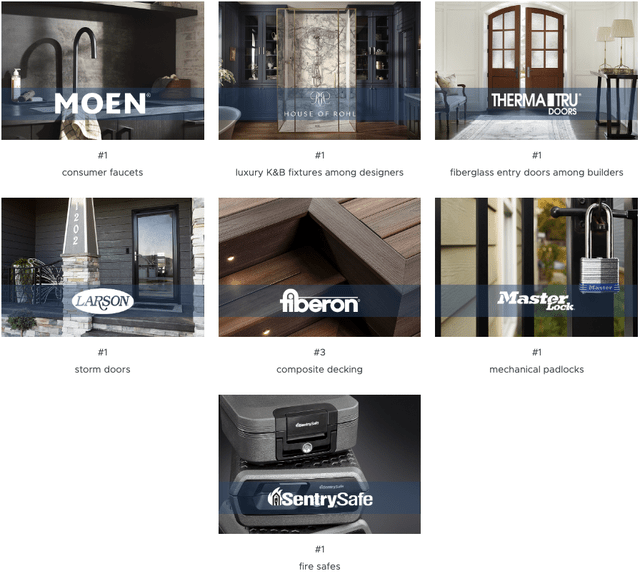
Data from Company’s Website
While FBIN boasts an impressive portfolio of brands, it’s essential to acknowledge that the company has faced challenges in capitalizing on this portfolio to drive revenue growth for its investors. To put it into perspective, within the competitive building products industry comprising 41 companies, FBIN secured the 34th position in revenue growth over the past 5 years and the 38th position in revenue growth over the last 3 years.
Despite facing a series of challenges in recent years, including mounting material costs, supply chain disruptions, and labor shortages, it’s essential to highlight that this comparison focuses solely on companies within the same industry as FBIN, all grappling with similar issues. These rankings serve as a noteworthy indicator that, despite its robust brand strength, FBIN’s management has yet to effectively translate it into significant revenue growth. For a comprehensive list of the companies included in this revenue growth comparison exercise, please refer to the link provided here.
Considering FBIN’s lackluster growth performance over the past decade, it comes as no surprise that the company has struggled to match the returns of the S&P 500 during this period, trailing the broader market significantly, with returns of 83.5% compared to the S&P 500’s robust 161.2% return.
It’s worth noting that while the S&P 500 has outperformed FBIN by a substantial margin, its price return of 83% far exceeds the company’s revenue growth of 27.51% and free cash flow growth of 59.2% over the same time frame. This misalignment between market returns and fundamental growth metrics suggests that a potential pullback in FBIN’s stock may be on the horizon.
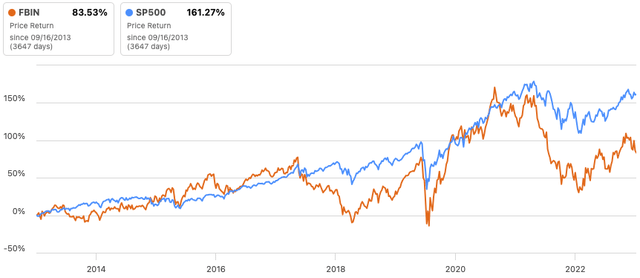
Data by Seeking Alpha
Outlook
Looking at FBIN’s earnings estimates, it’s apparent that the company is navigating a mixed trajectory. The consensus EPS estimates chart below, suggests while FBIN faces near-term challenges impacting its earnings, the company is expected to rebound and achieve substantial growth in the coming years.
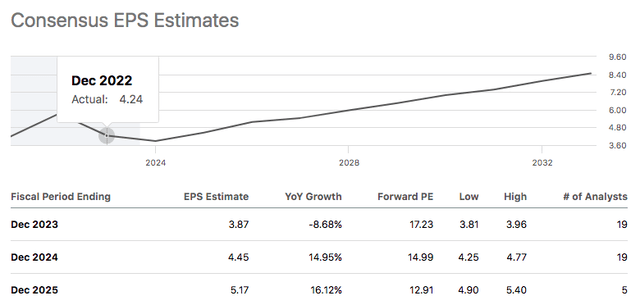
Data by Seeking Alpha
It’s important to approach analyst earnings estimates with a healthy dose of skepticism. While analysts are knowledgeable and well-informed, they don’t possess a crystal ball that predicts the future of a company’s earnings with absolute certainty. Economic, industry, and company-specific factors can be unpredictable, and unforeseen events can impact earnings.
However, this doesn’t mean we should disregard analyst estimates altogether. Instead, we should consider them as valuable tools for gaining a sense of general direction a company is headed in terms of its earnings. They provide a consensus view based on available information and analysis.
We believe that for FBIN to achieve the consensus EPS estimates, they’ll need to continue driving long-term growth through the “Fortune Brands Advantage,” strategy which encompasses four critical pillars. The first pillar is category management, which includes enabling partnerships with channel partners to gain consumer insights. Business simplification is the second pillar, this involves streamlining operations for increased efficiency, innovation, and branding.
The company’s third pillar is leveraging a global supply chain to achieve scale efficiencies and excellence. Additionally, Fortune Brands is making significant investments in digital transformation, this is the company’s final pillar, focusing on technology, data, analytics, and e-commerce. This strategic approach demonstrates Fortune Brands’ commitment to adaptability, innovation, and digital leadership, positively contributing to its long-term growth outlook.
Additionally, FBIN has made a couple big acquisitions in June 2023, adding Emtek and Schaub, a premium and luxury door and cabinet business and Yale and August residential smart locks business to its portfolio. The company paid $700 million for these two businesses, which represents 7.8x 2022 adjusted EBITDA before synergies.
Speaking of synergies, there’s significant potential for sales synergies within the new organization. The integration of Yale and August is expected to yield run-rate sales synergies ranging from $35 million to $45 million, primarily driven by the expansion of the retail business, growth in e-commerce and multifamily security channels, and a focus on innovating within the smart security and entry ecosystem.
Additionally, the combination of Emtek and Schaub is projected to result in run-rate sales synergies of approximately $30 million to $40 million. These synergies will be achieved by expanding cross-distribution in showrooms, introducing joint collections and marketing efforts with House of Rohl, and accelerating growth in e-commerce, multifamily, and hospitality sectors.
Furthermore, cost synergies of approximately $10 million to $20 million are anticipated through the efficient utilization of combined scale and capabilities in sourcing, design, logistics, and site optimization. As a result of these strategic initiatives, the company expects to achieve net sales ranging from $500 million to $550 million, inclusive of identified synergies, and anticipates EPS accretion of $0.45 to $0.55.
However, FBIN faces a notable threat from economic downturns that could significantly affect the company’s outlook for the future by leading to reduced consumer spending on home improvement projects. During such downturns, job losses, financial insecurity, and limited access to loans may discourage homeowners from investing in home renovations or additions. This downturn-related decline in spending can adversely affect FBIN’s sales and profitability, necessitating careful consideration and planning for resilience.
Predicting the path of the US economy is a complex task due to many unpredictable factors. Franklin Templeton’s “Anatomy of a Recession” is a useful guide in helping to understand the likelihood of a recession. Unfortunately, the latest findings from Franklin Templeton indicate a potential economic downturn, as nearly all indicators are pointing towards the possibility of an upcoming recession. If a recession does occur, it will undoubtedly have a negative impact on FBIN’s earnings.
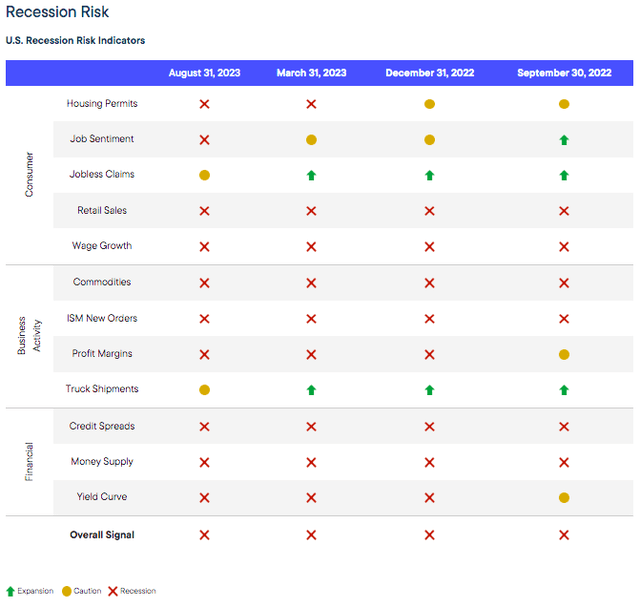
Data by Franklin Templeton
Valuation
In evaluating FBIN’s intrinsic value, we’ve applied a discounted cash flow analysis approach. We initiated this analysis with FBIN’s initial free cash flow of $320.20 million and considered the expected growth rates: a decline of -8.23% for 2023, followed by more optimistic growth rates of 14.95% for 2024 and 16.12% for 2025, which align with analyst expectations for FBIN’s earnings growth.
Predicting growth rates for the subsequent years, particularly for years 4 through 10, becomes considerably challenging. To address this uncertainty, we employed a growth rate of 14.26%, which would be necessary for FBIN to reach fair value. It’s important to note that the realism of this growth rate will be discussed later in our valuation.
Additionally, our analysis incorporates a discount rate of 10%, representing the market’s typical return with reinvested dividends, and a perpetual growth rate of 2.5%. These inputs are essential for aligning FBIN’s intrinsic value with its current share price.
Considering these inputs, if FBIN experiences an anticipated 8.23% decline in earnings for 2023, the company would need to achieve an annual growth rate of over 14% for the subsequent 9 years merely to reach fair value. Applying a margin of safety and aiming for a 40% return relative to the current share price would necessitate FBIN to attain a growth rate of 19.8% per year from year 2 through year 10, highlighting the rigorous growth expectations associated with this investment.
Considering the data at hand, it’s our assessment that FBIN is significantly overvalued. We harbor reservations about investing in a company that necessitates a staggering 19.8% growth over a 9-year span to rationalize a 40% return from the current share price. This is especially concerning when taking into account that the company has historically achieved a mere average growth rate of 3.61% in its free cash flow and revenue over the past decade. The substantial disconnect between the expected growth and the company’s historical performance raises serious concerns about the feasibility of such an investment.

Author’s Work
Takeaway
FBIN faces growth challenges. It has shown modest revenue and free cash flow growth over the last decade, falling short of our investment benchmarks. Despite a strong brand portfolio, FBIN lags competitors in revenue growth.
Analysts project future growth, but skepticism is warranted. FBIN’s “Fortune Brands Advantage” strategy aims for innovation and digital transformation, offering potential long-term benefits. Recent acquisitions could bring sales and cost synergies.
However, economic downturn risks exist, affecting home improvement spending. Our discounted cash flow analysis suggests FBIN is overvalued, needing exceptional growth to justify its stock price. Alternative opportunities may offer better risk-reward profiles. Based on this analysis, it is our recommendation to issue a sell rating for FBIN at this time.
Read the full article here


Leave a Reply