Franklin U.S. Mid Cap Multifactor Index ETF (BATS:FLQM) is a smart-beta ETF that follows a multi-factor selection process in an attempt to deliver better risk-adjusted returns with lower volatility than a vanilla mid-cap index.
So far, the ETF has been quite successful in delivering what it’s supposed to. If you are seeking exposure to mid-cap U.S. equities right now with a chance at outperformance, FLQM is your best bet. Its historically superior risk-adjusted returns and at the same time low beta make it ideal for that kind of need. The fees that it charges are also very reasonable for what it delivers.
In this post, I will expound on all of the above by making a few comparisons to its vanilla counterpart and one very relevant competing ETF. But first, allow me to give you a brief overview of its methodology.
Overview
| Launch Date | 04/26/2017 |
| Issuer |
Franklin Resources, Inc. |
| Manager |
Franklin Advisory Services, LLC. |
| AUM | $284.14M |
| Benchmark |
LibertyQ U.S. Mid Cap Equity Index |
| Goal | Replication |
| Holdings | 202 |
| Market Cap Target | Mid |
| Weighting |
Equal (each constituent <1%) |
Launched back in 2017 and focused on a relatively niche investment need, FLQM is a relatively small ETF based on AUM. It’s an index fund in the sense that it uses a full replication approach to track the performance of its underlying index, the LibertyQ U.S. Mid Cap Equity Index. However, this index uses a factor-based strategy.
The available universe of the underlying index is the Russell Midcap Index, a subset of the Russell 1000 Index (which includes the largest stocks of the Russell 3000 Index). Now, the Russell Midcap Index tracks the performance of the mid-cap stocks in the U.S. and includes about 800 stocks. And the goal of the FLQM is to outperform it on a risk-adjusted basis and with lower volatility in the long term. To that end, its underlying index selects stocks from the Russell Midcap Index which are seen as having favorable exposure to the following factors:
- Quality: Metrics such as return on equity, gross profit over assets, and gross margin sustainability are used to assess it.
- Value: Forward earnings yield, EBITDA to enterprise value, price to book value, and dividend yield are calculated to determine the strength of this factor.
- Momentum: 6-month and 12-month risk-adjusted price momentum are used.
- Low volatility: Historical beta is what the index uses to assess this.
Allocations
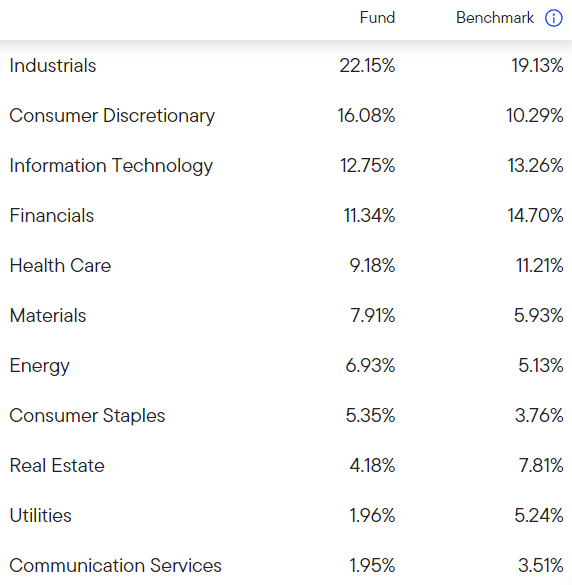
The ETF is currently concentrated in the Industrials sector, albeit not alarmingly much:
franklintempleton.com
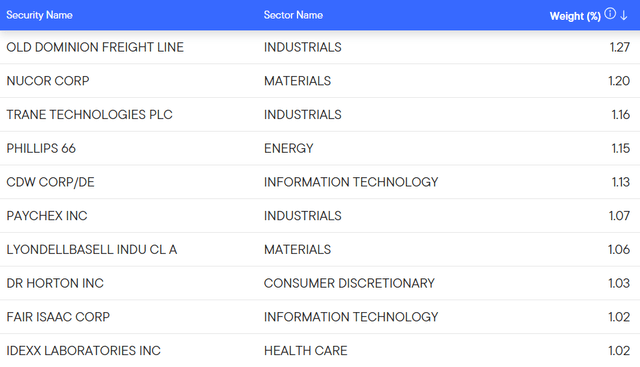
Regarding the individual positions, FLQM is well diversified. Its underlying index has a rule that no position should be given a weight of over 1%. Though some stocks have crossed that limit because of their recent appreciation, even the top 10 positions have conservative weights:
franklintempleton.com
The reconstitution is done semi-annually.
Cost
| Ticker | Expense Ratio | Turnover | Daily Volume |
| FLQM | 0.30% | 24% | 38,367 |
| JPME | 0.24% | 24% | 4,499 |
When it comes to the cost, I thought that the JPMorgan Diversified Return U.S. Mid Cap Equity ETF (JPME) would be a good pick for a relative assessment. This is another fund that uses a multi-factor approach when investing in mid-cap equities, so I find it the most relevant ETF to compare FLQM to.
As you can see, the turnover during the latest fiscal year for both funds was the same, but JPME has a slightly lower expense ratio. Regardless, its trading volume is so much lower, deeming it unattractive to hold when considering the cost. FLQM would be a more prudent choice.
Performance
Remember that the goal of FLQM is to outperform the Russell Midcap Index. Well, since 2017 its annual average return has been 11.5% on a market price basis. And the Russell Midcap Index has marked a 9.59% average increase every year.

franklintempleton.com
So far, it has been successful. However, the table above doesn’t fully capture how successful FLQM has been because fees and expenses don’t apply to an index. The graph below shows the ETF’s accumulative return since it launched against the iShares Russell Mid-Cap ETF (IWR) which tracks the Russell Midcap Index:
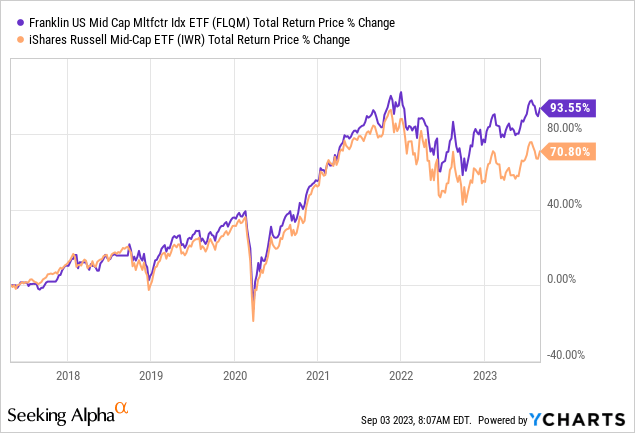
Now, the ETF is supposed to outperform the index on a risk-adjusted basis as well. Here is a backtested performance summary comparing it to IWR:

portfoliovisualizer.com
FLQM isn’t that much less volatile based on its maximum drawdown and standard deviation. That said, it has scored a higher Sharpe. And as I mentioned in the overview, its underlying index measures volatility using beta, not standard deviation. The same backest revealed a 0.99 beta for FLQM and 1.07 for IWR.
All in all, FLQM is efficient so far and has delivered what an investor would expect after investing in it. But an important question I had to also answer was: Is it the best for the job? We already witnessed how it probably is a better pick over JPME, the one managed by J.P. Morgan, on a cost basis. What about performance, though?
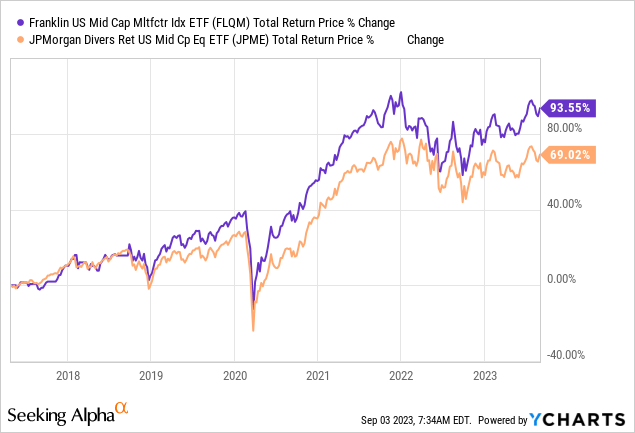
That’s quite the outperformance. Its risk-adjusted returns also appear superior:

portfoliovisualizer.com
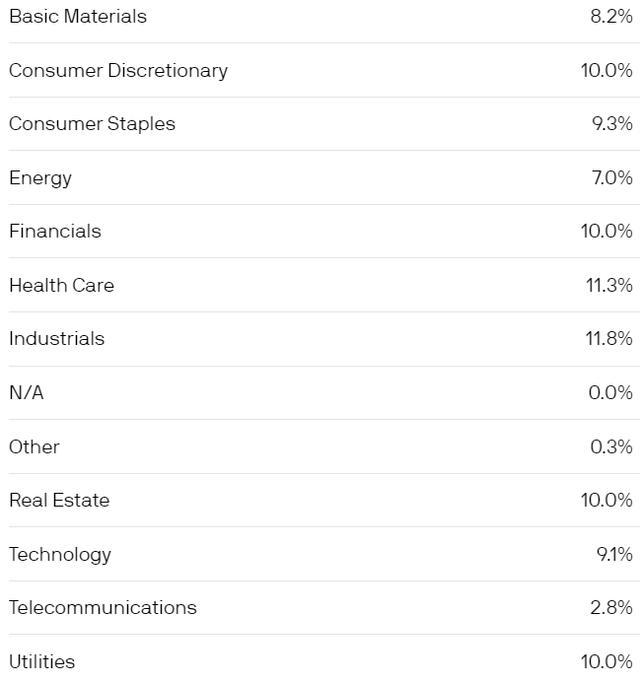
Of course, it would be unreasonable to think that this outperformance will continue without a good reason. In my view, there is a good reason that this outperformance will persist. I don’t know the exact methodology of each underlying index these funds track (both are focused on value, momentum, and quality), so I cannot identify superiority in either. What I do know, though, is that JPME gives an emphasis on sector diversification. Its prospectus states that its underlying index is “designed to evenly distribute risk across sectors and individual securities.” FLQM has individual position weight limits as we saw, but lacks any precaution to guard against sector concentration.
Here is the current sector allocations of JPME:
jpmorgan.com
Pretty diversified, right? The fund also holds 356 stocks right now, significantly more than FLQM’s holdings.
Basically, I have the impression that the more weight restrictions a portfolio has in place the more likely it is to outperform an identical one, all things being equal, in the long term. The selected holdings may not have the chance to show the fruits of a smart-beta approach. Though I understand that this is in the name of risk management, JPME is likely to continue outperforming FLQM because of this difference.
Risks
Let’s briefly go over the most significant risks that are specifically relevant to FLQM:
- Possible long-term underperformance to broad market: Since the ETF was launched, it has underperformed the SPDR S&P 500 ETF Trust (SPY). That is likely to be the case in the long term too. For someone who wants the best possible performance over a long period of investing in U.S. equities, the old advice of buying the entire market may be their best bet.
- Small AUM size: Currently, FLQM manages a few hundred million dollars, so you should consider the possibility that there is a narrow margin of safety regarding trading volume. If liquidity gets dry, this may result in wider bid-ask spreads and, consequently, higher indirect costs of buying the fund on a consistent basis.
- Industrials risk: The ETF is also concentrated in the Industrials sector, which can make its performance to be more volatile in the scenario of a downturn within the sector than it would be otherwise.
For the full list of risks associated with investing in FQLM, please take a look at the relevant prospectus.
Verdict
In conclusion, the fund is the most attractive option if you are looking for a smart-beta approach to mid-cap U.S. equities. Its fees are reasonable on both an absolute and relative basis and its historical performance indicates an ability to meet its goals.
What do you think? Let me know in the comments. I’m also interested to know how this fund would fit in your portfolio and what alternative you prefer if any. Thank you for reading.
Read the full article here


Leave a Reply