
In the past, I wrote a few articles concerning the water theme and investment vehicles that provide exposure to it. More specifically, I covered the Invesco Global Water ETF (PIO) as well as the Invesco Water Resources ETF (PHO) in October 2022, and the Invesco S&P Global Water Index ETF (CGW) in July 2022. None of them received a Buy rating from me, with valuation and quality concerns being the primary drivers of skepticism.
However, I have not yet provided an in-depth analysis of one of the largest names in this arena, the First Trust Water ETF (NYSEARCA:FIW), a fund with about $1.3 billion in assets under management, yet. And I suppose it is worth conducting one today.
In fairness, this is an ETF that clearly impressed me as its strategy was a source of consistent alpha in the past, with the fund heftily beating the iShares Core S&P 500 ETF (IVV) over the long run, even despite rather burdensome expenses. Moreover, neither the Industrial Select Sector SPDR® Fund ETF (XLI) nor the Utilities Select Sector SPDR® Fund ETF (XLU), two vehicles tracking cohorts of bellwether names from sectors FIW is most exposed to, saw gains substantial enough to compete with this water fund.
However, although there is always a temptation to use past performance as the central argument for a bullish thesis, it has never been and will never be a guarantee for similarly upbeat returns in the future. So instead of expecting alpha to last ad infinitum, it is worth analyzing factors like quality, growth, and value coldly to understand whether the combination is apt for the current market environment or not. And with FIW valued richly, I have serious concerns regarding its short-term performance.
FIW Strategy: Key Points
The basis for FIW’s strategy is the modified market cap-weighted ISE Clean Edge Water Index, which it has been tracking since its inception in May 2007; though the fund was renamed in December 2016, as detailed in the press release, it did not affect the strategy, and the underlying index remained the same. As described in the FIW factsheet, constituents of the index “derive a substantial portion of their revenues from the potable and wastewater industry.” Regarding eligibility, the fund’s website says there are “market capitalization, liquidity and weighting concentration requirements.” The target is 36 constituents. More details can be found in the prospectus.
Factors Under The Hood: Expensiveness, A Few Quality Issues
As of October 5, FIW’s portfolio consisted of 37 stocks, with the key five having an almost 21% weight and the smallest position, Veralto Corporation (VLTO) having a 40 bps weight. VLTO has just recently been spun off from Danaher Corporation (DHR). This explains why the number of holdings is now above the target of 36.
FIW has exposure to six GICS sectors, with industrials being the major one, accounting for more than half of net assets with 20 representatives, including the ETF’s largest position with a 4.4% weight, Ferguson plc (FERG). The smallest sector in this mix is consumer staples, with the only representative being Primo Water Corporation (PRMW). The table below compares FIW’s sector mix to PIO’s.
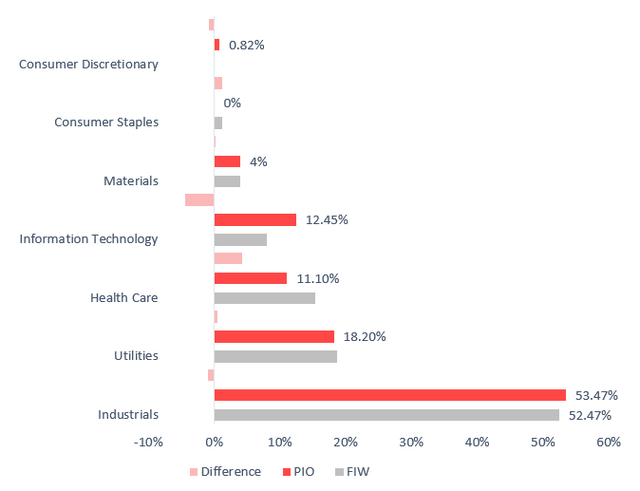
Created by the author using data from PIO, FIW
The allocations are mostly similar, with a caveat being the absence of consumer staple names in the PIO portfolio, while the First Trust ETF has no exposure to the consumer discretionary sector.
Now, the factor story should help us decide whether buying into FIW makes sense at this juncture. The table below contains the principal points worth discussing.
| Metric | 5-Oct |
| Market Cap | $20.89 billion |
| EY | 3.97% |
| P/S | 3.59 |
| EPS Fwd | 10.15% |
| EBITDA/EV | 5.7% |
| EBITDA Fwd | 10.33% |
| ROTC | 10.8% |
| ROA | 8.32% |
| Cash Flow/EV | 4.9% |
| Quant Valuation B- or higher | 10% |
| Quant Profitability B- or higher | 67.3% |
Calculated by the author using data from Seeking Alpha and the fund
- As we can see, FIW is predominantly a large-cap fund, mostly owing to the weighting schema of the index, which offsets the impact of 23 small- and mid-caps on the weighted average market cap of almost $21 billion.
- Unfortunately, even though we see large caps dominating the basket, FIW does not have the quality characteristics typical for that echelon. At first glance, there is just one loss-making company in the basket, Algonquin Power & Utilities Corp. (AQN), while both the weighted average Return on Assets and Return on Total Capital are at healthy levels. But this is just the tip of the iceberg. The problem is that a ~67% share of holdings with a B- Quant Profitability grades are too small; for a thematic fund, I would prefer a figure in the mid-80s.
- Next, the valuation is overall uncomfortable, starting with the earnings yield, which is below the one offered by IVV (3.97% vs. 4.65%). My opinion is that it is dangerous to bet on low-yield mixes at this point owing to interest rate risks.
- It is worth noting that the key contributors to the EY are industrial players and one utility name, 8.4% yielding Companhia de Saneamento Básico do Estado de São Paulo – SABESP (SBS), which is represented by an ADR.
- Besides, neither the debt-adjusted (EBITDA/EV) nor the cash flow yield look attractive enough.
- Furthermore, only 10% of the companies have earned a B- Quant Valuation grade.
- Finally, the weighted-average EBITDA and EPS growth rates above 10% look more than healthy. But growth is not what matters now.
Final Thoughts
FIW’s investment strategy focused on water distribution, infrastructure, purification & filtration, etc. delivered outstanding results in the past. For example, it outperformed IVV for four years in a row, starting in 2019. Over the June 2007–September 2023 period, it beat IVV by almost 1% in annualized total return, also having a less steep drawdown.
| Portfolio | FIW | IVV | XLI | XLU |
| Initial Balance | $10,000 | $10,000 | $10,000 | $10,000 |
| Final Balance | $44,603 | $38,674 | $36,079 | $25,261 |
| CAGR | 9.59% | 8.63% | 8.17% | 5.84% |
| Stdev | 19.34% | 15.97% | 19.87% | 14.89% |
| Best Year | 37.37% | 32.30% | 40.55% | 28.73% |
| Worst Year | -29.36% | -37.02% | -38.74% | -28.93% |
| Max. Drawdown | -46.08% | -50.78% | -57.16% | -38.05% |
| Sharpe Ratio | 0.52 | 0.54 | 0.45 | 0.39 |
| Sortino Ratio | 0.76 | 0.79 | 0.66 | 0.55 |
| Market Correlation | 0.91 | 1 | 0.94 | 0.51 |
Created by the author using data from Portfolio Visualizer
The issue is, however, its standard deviation, which was substantially higher compared to the S&P 500 bellwethers.
Over the March 2017–September 2023 period (EBLU has the shortest history), FIW’s performance also looks strong compared to its peers like PIO, PHO, CGW, and the Ecofin Global Water ESG Fund ETF (EBLU), though it lagged PHO slightly. Both FIW and PHO beat the S&P 500 ETF.
| Portfolio | FIW | PIO | PHO | CGW | EBLU | IVV |
| Initial Balance | $10,000 | $10,000 | $10,000 | $10,000 | $10,000 | $10,000 |
| Final Balance | $20,947 | $16,753 | $21,092 | $17,080 | $16,419 | $20,365 |
| CAGR | 11.89% | 8.15% | 12.00% | 8.47% | 7.82% | 11.41% |
| Stdev | 18.60% | 17.74% | 17.92% | 17.67% | 18.14% | 16.85% |
| Best Year | 37.37% | 35.59% | 37.57% | 34.04% | 38.73% | 31.25% |
| Worst Year | -15.70% | -24.05% | -14.86% | -21.99% | -26.72% | -18.16% |
| Max. Drawdown | -23.89% | -33.34% | -24.62% | -32.28% | -34.44% | -23.93% |
| Sharpe Ratio | 0.61 | 0.44 | 0.63 | 0.46 | 0.42 | 0.63 |
| Sortino Ratio | 0.92 | 0.63 | 0.96 | 0.65 | 0.6 | 0.94 |
| Market Correlation | 0.92 | 0.91 | 0.91 | 0.9 | 0.89 | 1 |
Data from Portfolio Visualizer
Nevertheless, a lot of gains have evaporated just recently amid the U.S. market turmoil reignited by inflation concerns aggravated by the oil price rally (already tamed, for now).
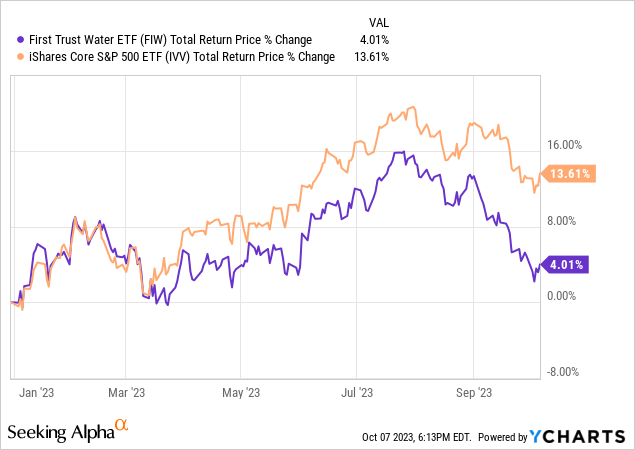
Overall, FIW has been mostly unsuccessful this year, underperforming IVV in March-May and July-September. In my view, though this softness might look like a buying opportunity, there is a risk of it declining further. In other words, the combination of a double-digit EPS growth rate and a low-single-digit earnings yield is not what investors should embrace now. It is worth focusing on higher yields and stronger profitability.
Read the full article here