
After a strong start to the year, global equity markets gave up some ground in the September quarter. Fortunately, the speculative appetite we saw from investors in the first two quarters started to lose some steam. Value benchmarks began clawing back some relative performance, which was encouraging. Stock valuations are stretched and continue to prove more favorable in the U.S. Small Cap and International arenas. U.S. Large Caps remain exceedingly top-heavy with performance being dominated by a handful of megacap companies that trade at significant premiums. Across geographies, cyclical stocks have been outperforming their more defensive counterparts; we are finding incremental opportunities in the latter.
While economic growth in the U.S. has been resilient, both Europe and China have come under mounting pressure. Inflation has been falling but remains elevated. Debt levels and borrowing costs have increased, which combined with higher labor and input costs, have weighed on corporate margins and earnings. Over the long-term, we remain optimistic and are excited to see a more normal interest rate environment. This should bode well for organic growth, stock picking, and value investing. With global value stocks trading near a historically wide discount to growth, the current set-up looks attractive from here. Any reversion to the mean should result in brighter days for those with a value orientation. We’ve got our sunglasses ready.
To that end, FMI gained on their respective core benchmarks in the period. The third quarter performance commentary is outlined below:
FMI Small Cap Equity
The FMI Small Cap Strategy declined approximately 1.7% (gross)/1.9% (net), compared to a fall of 5.13% and 2.96% in the Russell 2000 Index and Russell 2000 Value Index, respectively. Relative to the Russell 2000, sectors that contributed to the performance included Finance, Electronic Technology, and Retail Trade, while Commercial Services, Consumer Durables, and Distribution Services lagged. Not having exposure to Health Technology— which is littered with money-losing bio-technology companies— was also additive in the period. Some top individual performers included BJ’s Wholesale Club Holdings Inc., Zions Bancorporation N.A., and Houlihan Lokey Inc. Cl A, while Interpublic Group of Cos. Inc., LGI Homes Inc., and Fortune Brands Innovations Inc. weighed. Over 40% of the companies in the Russell 2000 and Russell 2000 Value lose money…not an area we typically look to invest. Our business quality focus has been a key to our outperformance in recent years.
FMI Large Cap Equity
The FMI Large Cap Strategy dropped approximately 2.3% (gross) / 2.4% (net), compared to a decrease of 3.27% and 3.19% in the S&P 500 Index and iShares Russell 1000 Value ETF([1]), respectively. Relative to the S&P 500, our Electronic Technology, Consumer Services, and Finance sector exposures boosted our performance, while Retail Trade, Commercial Services, and Health Technology lagged. Booking Holdings Inc., CDW Corp., and Micron Technology Inc. outperformed, while Dollar General Corp., Dollar Tree Inc., and Omnicom Group Inc. detracted. Year-to-date (YTD), the strategy performance has fallen squarely between the S&P 500 and iShares Russell 1000 Value ETF.(1) As each day passes, the S&P 500 looks progressively more like a concentrated growth index (additional color to follow). The S&P 500 Equal Weight index has lagged the S&P 500 by over 11% YTD, as the S&P 500 returns are being driven by a select few stocks. Despite higher interest rates, the Russell 1000 Value has underperformed the Russell 1000 Growth Index by ~23% YTD, an extreme gap by historical standards; we don’t think the market’s lurch back to growth this year will persist.
FMI All Cap Equity
The FMI All Cap Strategy was lower by approximately 2.0% (gross) / 2.1% (net), compared to a loss of 3.31% in the iShares Russell 3000 ETF(1). Relative to the iShares Russell 3000(1), our sector exposures in Finance, Electronic Technology, and Producer Manufacturing were additive to performance, with Retail Trade, Commercial Services, and Health Technology each lagging. Houlihan Lokey Inc. Cl A, Booking Holdings Inc., and BJ’s Wholesale Club Holdings Inc. outperformed, while Dollar General Corp., Dollar Tree Inc., and Omnicom Group Inc. detracted. Similar to the large cap space, the iShares Russell 3000(1) has benefited from the persistent demand for growth equities.
FMI International Equity
The FMI International Strategies fell approximately 0.2% (gross)/ 0.4% (net) on a currency hedged basis and 3.3% (gross) / 3.4% (net) currency unhedged, compared with the iShares Currency Hedged MSCI EAFE ETF(1) decline of 1.13% and 4.94% for the iShares MSCI EAFE ETF(1). The iShares MSCI EAFE Value ETF(1) lost 0.02% during the same period. Relative to the iShares MSCI EAFE ETF([2]), top contributing sectors included Producer Manufacturing, Consumer Services, and Industrial Services, while Health Technology, Finance, and a lack of exposure to Energy Minerals weighed. Strong individual contributions came from Schlumberger Ltd., Booking Holdings Inc., and Howden Joinery Group PLC, while Smith & Nephew PLC, Samsung Electronics Co. Ltd. Preferred, and Barry Callebaut AG gave up some ground. The iShares MSCI EAFE Value ETF(1) outperformed significantly in the period, with the “deeper value” Energy and Finance sectors leading the way. FMI is typically under-weight these sectors due to business quality and balance sheet concerns. A strong USD was a tailwind for FMI’s currency hedged portfolio in the quarter.
The Bigger You Are The Harder You Fall
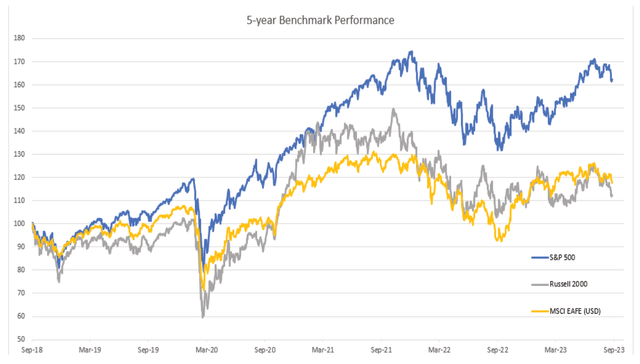
As illustrated in the chart below, the last five years have created a windfall for investors in the S&P 500 (U.S. Large Cap stocks), as it has trounced other asset class benchmarks, including the Russell 2000 (U.S. Small Cap stocks) and the MSCI EAFE (International Large Cap stocks). The performance gap has blown out again in 2023, and now stands at approximately 48% and 43%, respectively, over the full five-year period.
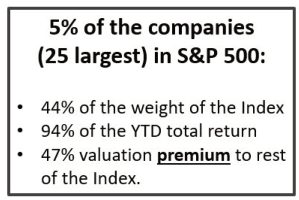
With this divergence comes risk. The concentration in the S&P 500 is truly extraordinary. The top 5% of the companies (25 largest) account for around
44% of the weight of the index, 94% of the YTD total return, and trade at an average valuation premium of 47%([3]) to the rest of the index. Expectations remain high for those chosen few. As illustrated in last quarter’s letter, leaders rise and fall, and this is consistent across business cycles (only one of the top ten companies in the S&P 500 in 2000 was in the top ten in 2020). Today’s exuberance has some earmarks of the “Nifty Fifty” in the 1970s, where investors crowded like lemmings into 50 indisputable companies, pushing valuations to extremes. The speculative fever eventually broke – between 1973-74, when the Dow fell ~42%, while the “Nifty Fifty” dropped ~59%! Unfortunately, investors appear to have very short memories, and most were not alive through this painful experience. While market cycles are never identical, from the top they do have a long history of transitioning from overvalued to undervalued, as human nature doesn’t change (fear and greed). As we highlighted last quarter, the lion’s share of the top performing themes in the U.S. fell in the speculative camp, and for that we feel that caution is warranted today.
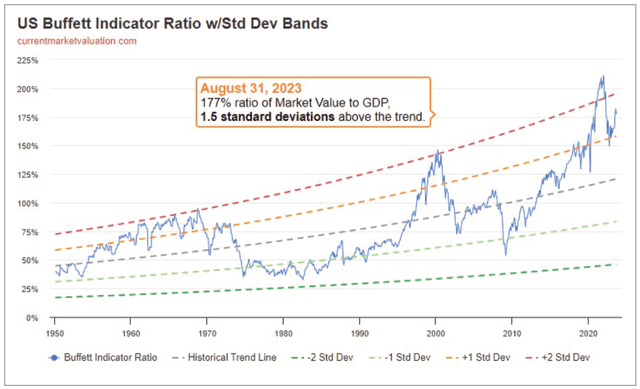
Valuations in the U.S. have ballooned, with numerous warning signals now flashing red. Through The Leuthold Group, we track 46 different valuation metrics, dating as far back as 1926. On a median basis, we are currently in the 10th decile of historical valuation – one of the most expensive stock markets in U.S. history. The widely referenced Buffett Indicator, measuring market value to GDP, tells a similar story of overvaluation (see chart below). JPMorgan writes, “Equities are up YTD on multiple expansion while real rates and cost of capital are moving deeper into restrictive territory. History suggests this relationship is becoming increasingly unsustainable, with the S&P 500 multiple over-valued by 3-4x vs. real rates, posing risk to valuations, especially since earnings expectations already face a high hurdle for 2024.”
Fortunately, there are attractive relative values outside of the megacap companies in the S&P 500. As we pointed out last quarter, the discount for U.S. Small Caps vs. U.S. Large Caps is near an all-time high, as are European valuations vs. domestic. All of FMI’s portfolios trade at a significant discount to the core benchmarks, and we invest in above-average businesses with strong balance sheets. We see compelling opportunities across our holdings, with a collection of all-weather vehicles that can withstand these tough and unpredictable times.
China’s House of Cards
The macro environment features numerous headwinds, including waning global growth, record debt levels, elevated inflation, rising interest rates, and heightened geopolitical risks. On the growth front, the U.S. has been the most robust developed economy, with a strong labor market and a resilient consumer. That said, the OECD expects U.S. real GDP to slow to a “soft landing” from 2.2% in 2023 to 1.3% in 2024. European growth has already hit the skids, falling to 0.6% in 2023 with 1.1% expected in 2024. High food and energy inflation has weighed, business activity and bank lending has slowed, and a higher cost of borrowing is impacting investment, among other factors.
China, which just months ago was expected to account for almost 35% of global growth this year, has run into significant challenges. The property sector, which we have long described as a dangerous and a speculative bubble, has finally popped. In recent years, housing accounted for as much as 25% of China’s GDP. The property sector, which holds 70% of China’s households’ wealth, is ailing. Property sales are down nearly 40% from their 2021 peak, housing starts have fallen 60%, and prices have dropped 33%. Developer defaults and business losses are commonplace, and more strain may be on the horizon. Leverage in China is up dramatically, with total credit up 8.5 times since 2008, even as GDP is up less than half that (3.9 times).
China’s problems don’t end there. Their demographics are poor, with a working age population in decline since 2011 and a total population that started to shrink in 2022. Productivity growth is slowing, exports are weak, youth unemployment is high, and tensions with the West are rising. The glory days for the world’s second largest economy may be behind them. Unfortunately, additional weakness in China would be felt worldwide. Risks abound.
Not So Expensive Defensives
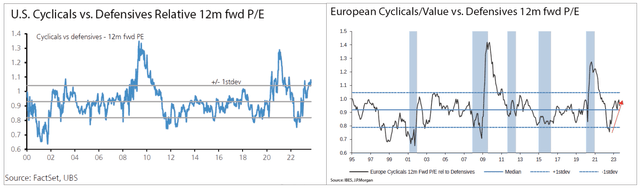
Despite the weakening economic backdrop described above, cyclical stocks have surprisingly outperformed “defensives” (steady, less-cyclical businesses) in both the U.S. and Europe over the past year. As illustrated on the following page, valuations are looking more attractive on the defensive side of the equation. In the U.S., cyclicals are trading around a standard deviation above historical levels from a relative price-to-earnings standpoint, while in Europe they are trading above the historical median, but are not quite as extended.
We have found some interesting opportunities among the defensives that have been left behind. In the third quarter, we added a new position to each of our portfolios which fit the description. The idiosyncratic investment case for these new purchases is outlined below:
Valvoline Inc. (VVV) – Small Cap
After a long history of underinvestment under Ashland and a messy seven years as a standalone public company, Valvoline is finally a pure-play quick lube retailer, having sold their motor oil business earlier this year. We like the business model for its stability, growth potential, pricing power, and high returns on capital. The business offers customers a better oil change experience relative to the alternatives. Going forward, the story will be simpler to understand, the analyst coverage will be uniform, and it should get reclassified as retail. In the current environment, Valvoline has the added benefit of having a tight store-level culture that helps minimize labor turnover, and has effectively no shrink, which is currently a major thorn in the side of retailers. Given Valvoline’s choppy history (thanks to the divested motor oil business), we believe investors are in a wait and see mode as the company proves out its standalone financial results and accelerates its organic store expansion. Increased penetration in a fragmented market, expanded usage of synthetic oils, and a consistent experience as consumers continue to shift to do-it-for-me, should drive strong earnings per share growth at high incremental returns. Although we believe we can get an attractive return from just the growth, there is the chance for a higher valuation as Valvoline puts up its first year of (nearly) clean financials in Fiscal Year 2024. We also believe the short- to medium-term threat of electric vehicles is manageable. If our growth expectations are achieved, the downside is modest even if the multiple compresses meaningfully over our five-year investment horizon. We expect investors will increasingly appreciate Valvoline’s simple, high return model after a long period of being obfuscated by inferior businesses.
Sysco Corp. (SYY) – Large Cap/ All Cap
Sysco Corp. is the largest global distributor of food and related products to the foodservice or food-away-from-home industry.
Sales in the U.S. account for approximately 82% of the company’s consolidated revenue, with the remainder mainly coming from Canada, Latin America, and Europe (18%). The company provides products and related services from thousands of suppliers to over 725,000 customer locations including restaurants (~62% of sales), education and government facilities (~8%), travel and leisure establishments (~8%), healthcare facilities (~7%), and other foodservice customers (15%). Sysco possesses many business characteristics that FMI finds attractive. The company has a dominant market position in a large, growing, resilient industry. They sell necessary, consumable products. Economies of scale allow Sysco to provide a better offering than peers while also allowing them to operate with higher margins. These advantages have helped Sysco take market share over time and earn a return on capital that consistently exceeds its cost of capital. We believe that Sysco will continue to grow its market share in the large and fragmented foodservice distribution market and should be able to generate mid-single-digit EBIT growth over time. When combined with share repurchases and dividend yield, the company should generate a high-single-digit to low-double-digit total return to investors without multiple expansion. The shares are trading at a depressed valuation relative to the S&P 500 and relative to the company’s history, which we believe provides us downside protection and could generate additional upside should it revert to the historical levels.
Coca-Cola Europacific Partners PLC (CCEP) – International
Coca Cola Europacific Partners (CCEP) is the largest Coca-Cola bottling franchise, accounting for an estimated 1/3rd of Coca-Cola System profits. CCEP sells whatever it deems to be the optimal mix of The Coca-Cola Company’s (OTC:TCCC) 200+ brands in its 30 countries (from its owned bottling plants and coolers) and CCEP sets all prices. Over the last decade plus, alignment has been structurally enhanced between TCCC and the top bottling groups through incidence-based pricing (sales value rather than volume) and through direct ownership. Bottlers are increasingly benefiting from TCCC’s innovation and overall “total beverage” strategy (including TCCC’s acquired and licensed brands in energy drinks and ready-to-drink coffee, alcohol, and more). By year-end 2023, CCEP should also generate 28% of sales from the faster growing Asia-Pacific region (with no sales in China). CCEP is inexpensive compared to other global staples, with nearly 2x the average free cash flow yield. Compared to its own seven-year history, it trades at a significant discount on a price-to-earnings basis. It offers attractive defensive growth potential and predictable capital allocation.
Thank you for your continued support of Fiduciary Management, Inc.
Read the full article here