This article series aims at evaluating exchange-traded funds, or ETFs, regarding the relative past performance of their strategies and quality of their current portfolios. As holdings and data change over time, updated reviews are posted when necessary.
FDD strategy and portfolio
First Trust STOXX® European Select Dividend Index Fund ETF (NYSEARCA:FDD) started investing operations on 8/27/2007 and tracks the STOXX Europe Select Dividend 30 Index. It has 30 holdings, an attractive 12-month distribution yield of 6.66% and a total expense ratio of 0.58%. Distributions are paid quarterly.
As described in the prospectus by First Trust, the underlying index selects companies in the STOXX Europe 600 Index with a non-negative 5-year dividend growth rate and a dividend-to-earnings ratio of 60% or less.
For every eligible company, the dividend yield is divided by the dividend yield of its country index. Initially, the securities with the 30 best ratios are included in the index. Constituents are not removed as long as they are ranked in the top 60. When constituents are removed, the highest ranked candidates are added until reaching 30 constituents. They are weighted based on their net dividend yields, with a maximum weight of 15%. The index is reconstituted and rebalanced annually.
As of writing, the fund is invested mostly in large cap companies (58% of asset value) and to a lesser extent in mid-caps (39%).
I will use as a benchmark the MSCI Europe Investable Market Index, represented by the iShares Core MSCI Europe ETF (IEUR). The U.K. and France are the top two countries in both funds, with an aggregate weight of 37.4% in FDD and 40.8% in IEUR. The next chart plots FDD top 10 countries, representing 97.6% of assets (and 90.6% in IEUR).
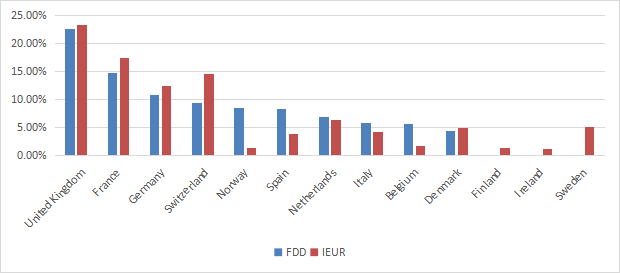
Country allocation (chart: author: data: FirstTrust and iShares)
The fund is overweight in financials (34.1% of asset value in this sector). Then, come materials (18.4%), utilities (13.3%) and consumer discretionary (10.7%). Other sectors are below 9%. Compared to the benchmark, FDD overweights the top 3 sectors, along with real estate and communication. It underweights industrials, energy, and totally ignores healthcare, consumer staples and technology.
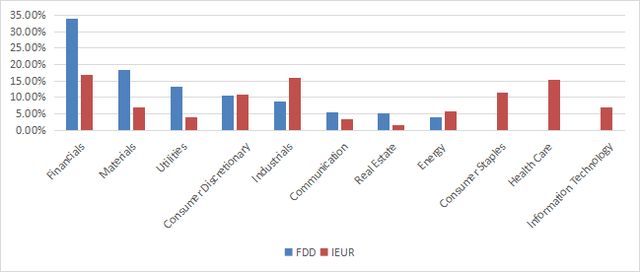
Sector breakdown (chart: author; data: FirstTrust and iShares)
FDD looks much cheaper than IEUR regarding the usual valuation ratios, reported in the next table. A note of caution, though: it is biased by financials, where these metrics are lower and less reliable than in other sectors.
|
FDD |
IEUR |
|
|
P/E TTM |
7.02 |
13.49 |
|
Price / Book |
1 |
1.8 |
|
Price / Sales |
0.64 |
1.23 |
|
Price / Cash Flow |
4.39 |
8.71 |
The top 10 holdings, listed below, represent 42.4% of asset value. The portfolio is quite concentrated, but risks related to individual companies are moderate: the heaviest constituents are below 5%.
|
Name |
Identifier |
Sector |
Weight |
|
Taylor Wimpey Plc |
TW/.LN |
Consumer Discretionary |
4.72% |
|
A.P. Moeller – Maersk A/S (Class A) |
MAERSKA.DC |
Industrials |
4.48% |
|
Glencore Plc |
GLEN.LN |
Materials |
4.48% |
|
Yara International ASA |
YAR.NO |
Materials |
4.43% |
|
ACS, Actividades de Construccion y Servicios, S.A. |
ACS.SM |
Industrials |
4.23% |
|
Rio Tinto Plc |
RIO.LN |
Materials |
4.16% |
|
Endesa, S.A. |
ELE.SM |
Utilities |
4.09% |
|
Legal & General Group Plc |
LGEN.LN |
Financials |
4.06% |
|
Aker BP ASA |
AKRBP.NO |
Energy |
4.01% |
|
NN Group N.V. |
NN.NA |
Financials |
3.76% |
Past performance
The next chart compares total returns since IEUR inception in June 2014. FDD has underperformed the MSCI index by 21% in about 9 years (about 2% in annualized return).
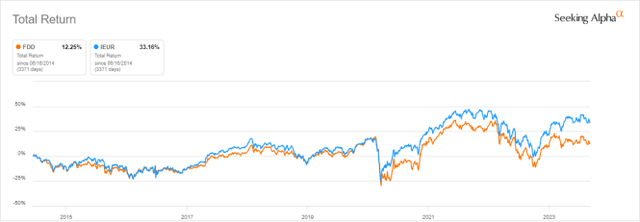
FDD vs. IEUR since June 2014 (Seeking Alpha)
The next chart compares 5-year total returns of the same funds and 2 Europe dividend ETFs with assets over $50M:
- WisdomTree Europe Quality Dividend Growth Fund (EUDG)
- WisdomTree Europe SmallCap Dividend Fund (DFE).
FDD has lagged both IEUR and EUDG, and it is ahead of the small-cap fund DFE.
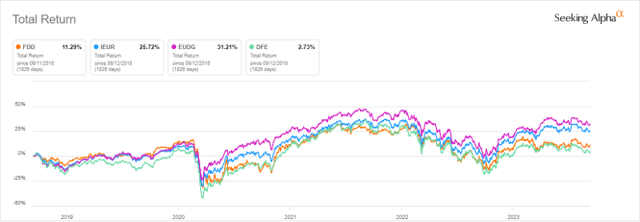
FDD vs. Competitors, 5-year total return (Seeking Alpha)
The share price fell sharply in the 2008 crisis and it has never recovered, going sideways since then.
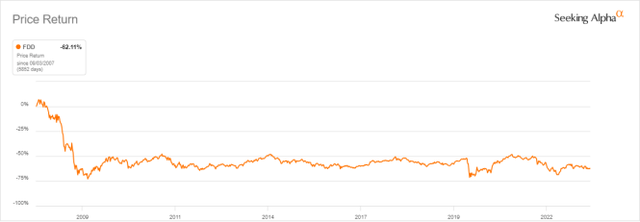
FDD share price since inception (Seeking Alpha)
The annual sum of distributions has increased from $0.61 per share in 2012 to $0.69 in 2022: it is a growth rate of 13.1% (only 1.2% annualized). In the same time, the cumulative inflation has been about 29%, based on CPI.

FDD distribution history (Seeking Alpha)
Currency rates have played against FDD: the dollar has gained about 25% vs. the Euro since inception, and about 22% in 10 years. However, even measured in Euro, performance and dividend growth are quite unattractive relative to inflation. Some assets are not in Euro (U.K., Norway, Switzerland), it’s just a way to see the fund’s performance from a European point of view.
Takeaway
First Trust STOXX European Select Dividend Index Fund picks 30 European stocks with high yields relative to country averages. The portfolio is overweight in financials, and the top countries are the U.K. and France. Valuation ratios look very attractive, but the concentration in financials makes them questionable. Income-oriented investors may be seduced by the yield, but historical performance and dividend growth are underwhelming.
For investor seeking European exposure and dividends, a dividend growth fund with quality characteristics by WisdomTree (EUDG) has done a better job in the last 5 years. It has a lower yield (2.5%), but a higher total return a steadier distribution growth.
Read the full article here




Leave a Reply