“Equities climb a wall of worry”, as the saying goes.
Speaking of worries, the Fear and Greed Index hit “Extreme Fear” territory in the first week of October. In the second week of October, geopolitical tensions shot higher due to the Israel-Palestine conflict.
So on top of having to deal with persistently high bond yields and a strong USD, investors now have to contend with the uncertainty of geopolitical tensions.
This is why I always advocate to ignore the headlines and noise and listen to price. Equity markets are displaying a high degree of resilience despite the negative headlines, during a period where equities tend to put in a seasonal bottom before a strong November-January.
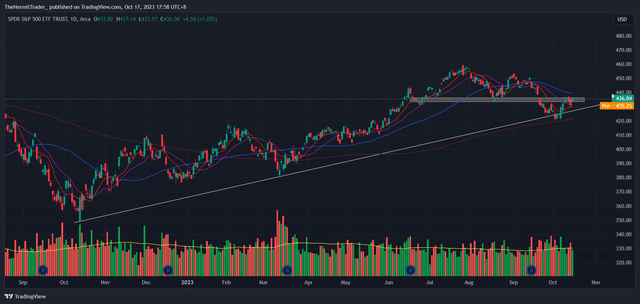
When we look at the S&P 500 (NYSEARCA:SPY), we may observe that the index bounced very strongly off the 200-day moving average and off its uptrend support on 6 October.
Daily Chart: SPY
TradingView
Since then, the SPY has been resiliently building higher, and has reclaimed its 10- and 20-day moving averages. A stronger-than-expected CPI number last week on 12 October sparked off a mini-pullback, which was likely given that the SPY was trading near structural resistance.
However, the SPY then surged right back at resistance on 16 October and is close to reclaiming its pre-CPI levels. This is very constructive, and if prices can reclaim above $437, it sets the stage for a test of the 50-day moving average at $440, and possibly beyond.
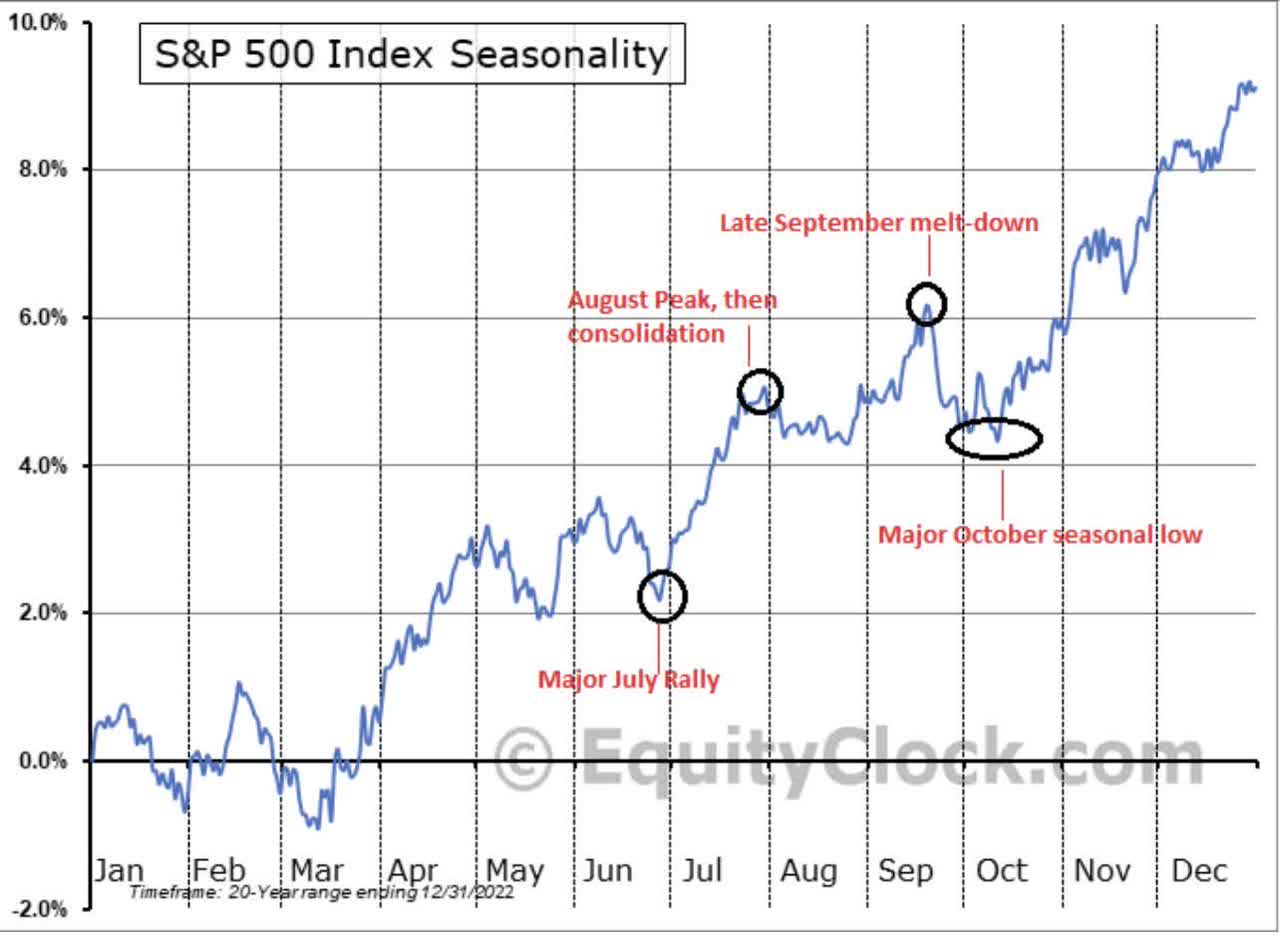
Putting this price action in context with seasonal trends, we may observe that time is in favour of the bulls. The SPY tends to put in a major low in October, based on the past 20 years of data – more accurately, sometime in the middle of the month. The longer the SPY stays afloat and does not sell off violently, the higher the probability that it enters a strong 3-month period lasting till mid-January.
Equity Clock
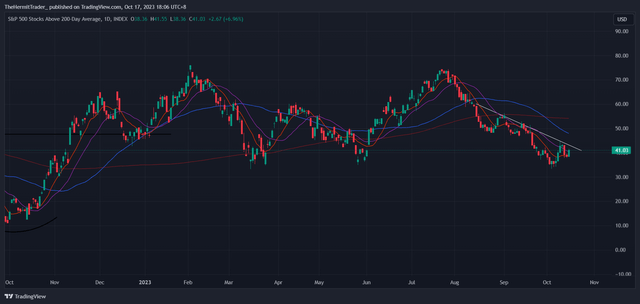
Looking at market breadth, which looks at how the stocks that make up the index are doing, we may observe that the “internal health” of the index is extremely poor. The number of stocks within the SPY that are above their 200-day moving averages stands at 41%, which is close to the year’s lows.
However, this chart may be starting to base out, and I am watching for it to break out of its downtrend.
Daily Chart: S&P 500 Stocks Above 200-Day Moving Average
TradingView
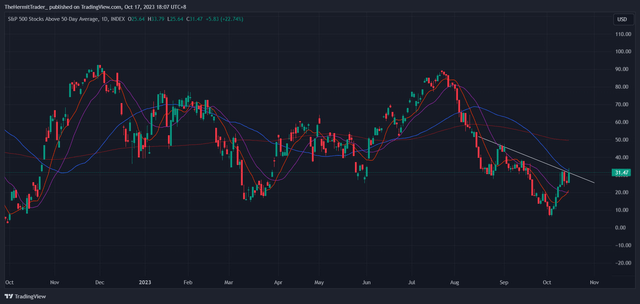
Similarly, when we look at the percentage of stocks within the SPY that are trading above their 50-day moving averages, the percentage stands at a paltry 31%. This indicator hit YTD lows at the start of October and may be starting to thrust higher.
Daily Chart: S&P 500 Stocks Above 50-Day Moving Average
TradingView
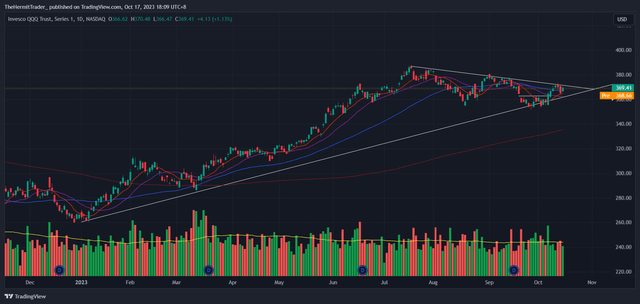
The picture in QQQ is very similar to that of the SPY, as we can see that the index has also respected uptrend support and is now starting to reclaim some of its moving averages on the daily chart. The QQQ is close to testing its downtrend resistance, and may in fact break out ahead of the SPY.
I would not be surprised if QQQ leads the market higher. I opined here on 11 October that QQQ is displaying very high relative strength, and I am looking for new highs in the index.
Daily Chart: QQQ
TradingView
The technical charts of the mega-cap stocks that make up the SPY and QQQ are pretty strong.
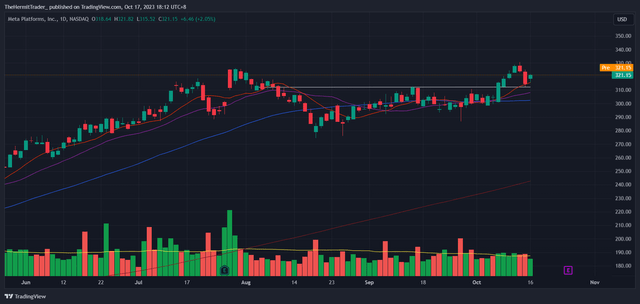
Meta Platforms (META) is holding up well after breaking out higher from a multi-week base. It is trading above its key moving averages on the daily chart, and I expect it to trend higher.
Daily Chart: META
TradingView
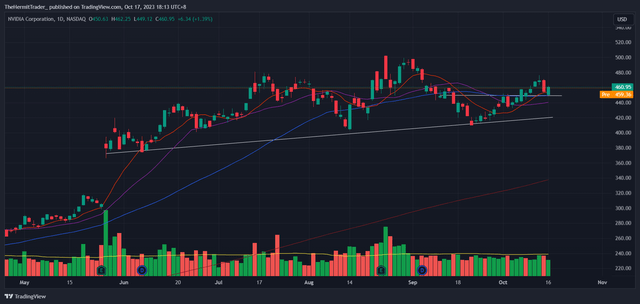
NVIDIA (NVDA) is holding up well above its $449 pivot after breaking out of a mini base. It is trading above its key moving averages on the daily chart. During a market pullback, I focus on names that are trading close to new highs and which are trading above their key moving averages. These are ahead of the broad market (we looked at market breadth earlier), and are likely to lead the market in terms of performance going forward.
Daily Chart: NVDA
TradingView
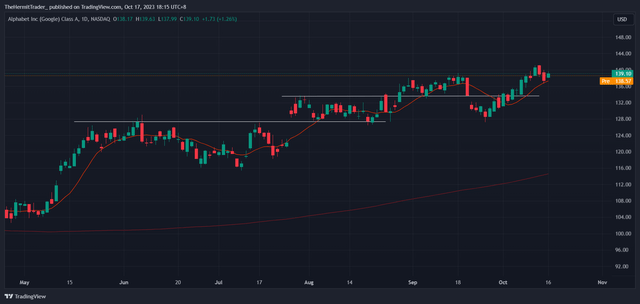
Alphabet (GOOGL) (GOOG) looks pretty bullish, holding above its September swing highs, and is also above its key moving averages.
Daily Chart: GOOGL
TradingView
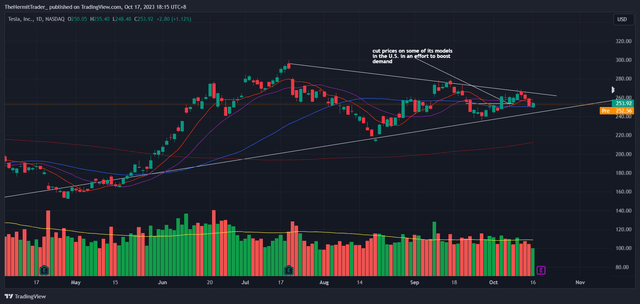
Tesla (TSLA) is bouncing about within a triangle consolidation pattern and looks likely to choose a direction soon. The longer-term chart is bullish, so it is likely that the daily chart resolves to the upside. We will see what happens after its earnings on 18 October.
Daily Chart: TSLA
TradingView
Overall, there is an abundance of reasons to be risk-off, and geopolitical tensions tend to evoke very emotional responses from the markets.
However, we have to focus on price action, and it is showing that the path of least resistance for indices is higher.
I opined recently here that war-related charts are not backing down, indicating the market is pricing in increased probability that geopolitical tensions might escalate. However, I would not be surprised to see the overall market heading higher at the same time.
Read the full article here


Leave a Reply