This article series aims at evaluating ETFs (exchange-traded funds) regarding past performance and portfolio metrics. Reviews with updated data are posted when necessary.
EFV strategy and portfolio
iShares MSCI EAFE Value ETF (BATS:EFV) started investing operations on 8/1/2005 and tracks the MSCI EAFE Value Index. It has 506 holdings, a 12-month distribution yield of 3.75% and an expense ratio of 0.34%. Distributions are paid semi-annually.
As described in the prospectus by iShares:
The Underlying Index targets approximately 50% coverage of the free float-adjusted market capitalization of the MSCI EAFE Index and consists of those securities classified by MSCI as most representing the value style of investing. Securities classified in this style generally tend to have higher value characteristics (i.e., higher book value to price, 12-month forward earnings to price and dividend yield).(…) Each security (in the MSCI EAFE Index) is evaluated based on certain value factors and growth factors, which are then used to calculate a value score and growth score. Based upon these two scores, MSCI determines the extent to which each security is assigned to the value or growth style.
The process of creating overlapping value and growth sets in a parent index is similar to the definition of value indexes by S&P Dow Jones Indices. However, some ratios used in the calculation differ. The portfolio had a turnover rate of 26% of its average value in the last fiscal year.
In this article, I will compare EFV to its parent index, represented by iShares MSCI EAFE ETF (EFA), and an actively managed international value fund, Dimensional International Value ETF (DFIV), reviewed here. They are all ex-U.S. developed markets funds, mostly invested in large companies: about 88% of asset value for EFV, 89% for EFA, 82% for DFIV.
Regarding the usual valuation ratios, reported in the next table, EFV is significantly cheaper than its parent index, and slightly more expensive than the actively managed fund by Dimensional.
|
EFV |
EFA |
DFIV |
|
|
Price/Earnings TTM |
9.81 |
13.67 |
8.88 |
|
Price/Book |
1.11 |
1.67 |
0.99 |
|
Price/Sales |
0.87 |
1.27 |
0.71 |
|
Price/Cash Flow |
6.01 |
9.31 |
5.14 |
Source: Fidelity
It is also better than EFA at finding stocks combining value and growth. DFIV looks even better for “good” growth: in earnings and cash flow rather than sales.
|
EFV |
EFA |
DFIV |
|
|
Earnings growth % |
16.06% |
13.96% |
19.05% |
|
Sales growth % |
10.36% |
9.68% |
9.77% |
|
Cash flow growth % |
13.36% |
9.52% |
15.73% |
Source: Fidelity
The 3 funds have common points in their geographical allocation: Europe is the heaviest region, and Japan, the U.K. and France are the top countries. Canada has almost a 10% weight in DFIV, whereas MSCI EAFE indexes exclude this country along with the U.S. Hong Kong weighs 2.15% of assets, so direct exposure to geopolitical and regulatory risks related to China is low.
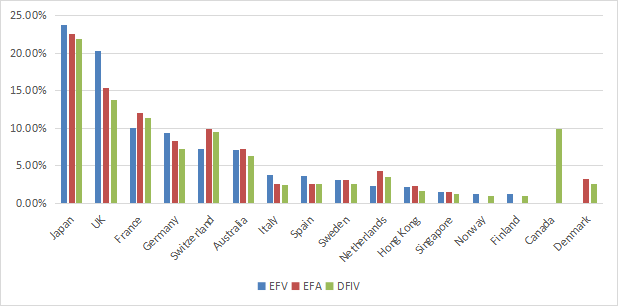
Country allocation (chart: author: data: iShares, Dimensional)
Financials are the heaviest sector in the 3 funds. The two value funds overweight this sector relative to the benchmark EFA, and they almost ignore technology. The top industry in EFV portfolio is banks, with about 17% of asset value.
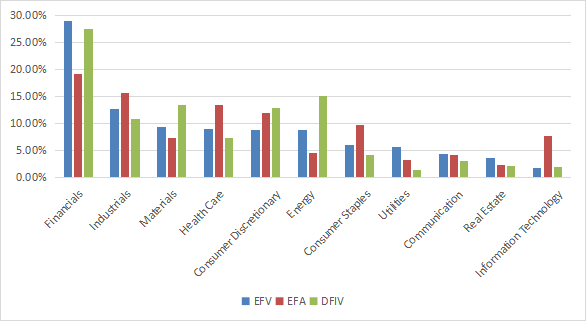
Sector breakdown (chart: author: data: iShares, Dimensional)
The next table lists the top 10 holdings, representing 19.5% of assets. The heaviest one weighs 2.8%, so risks related to individual companies are moderate.
|
Ticker |
Name |
Weight % |
Sector |
Location |
|
SHEL |
SHELL PLC |
2.83 |
Energy |
United Kingdom |
|
NOVN |
NOVARTIS AG |
2.65 |
Health Care |
Switzerland |
|
7203 |
TOYOTA MOTOR CORP |
2.45 |
Consumer Discretionary |
Japan |
|
HSBA |
HSBC HOLDINGS PLC |
2.11 |
Financials |
United Kingdom |
|
TTE |
TOTALENERGIES |
1.92 |
Energy |
France |
|
BHP |
BHP GROUP LTD |
1.9 |
Materials |
Australia |
|
SAN |
SANOFI SA |
1.64 |
Health Care |
France |
|
BP. |
BP PLC |
1.43 |
Energy |
United Kingdom |
|
ALV |
ALLIANZ |
1.28 |
Financials |
Germany |
|
8306 |
MITSUBISHI UFJ FINANCIAL GROUP INC |
1.27 |
Financials |
Japan |
Performance
Since inception, EFV has lagged its parent index by about 1% in annualized return and 32% in total. It also shows a slightly higher risk measured in maximum drawdown and volatility.
|
Total Return |
Annual Return |
Drawdown |
Sharpe ratio |
Volatility |
|
|
EFV |
79.29% |
3.27% |
-64.40% |
0.19 |
18.87% |
|
EFA |
111.88% |
4.22% |
-61.04% |
0.24 |
17.62% |
DFIV was listed on 09/13/2021. Since this date, both value funds have outperformed the benchmark, and DFIV has been the best performer.
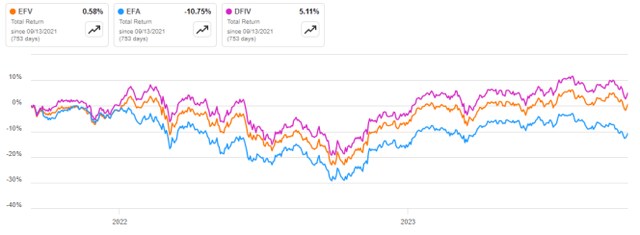
EFV vs EFA, DFIV (Seeking Alpha)
With a yield close to 4%, EFV may be considered a dividend fund in addition to a value fund. Between 2012 and 2022, distributions have increased by 4.37% from $1.83 to $1.91 per share. It is far behind the cumulative inflation, which has been about 29% in the same period, based on CPI. Moreover, distributions have been uneven, as reported in the next chart.

Distribution history (Seeking Alpha)
Takeaway
iShares MSCI EAFE Value ETF holds about 500 stocks from developed markets except the U.S. and Canada. The two heaviest countries in the portfolio are Japan and the U.K. The fund is overweight in financials: 29% of assets, with about half of it in banks. EFV is superior to its parent index regarding valuation and growth metrics. EFV has lagged EFA since 2005, but it has outperformed it in the last 2 years. DFIV, an actively managed value fund in a similar stock universe, looks better than EFV in valuation, growth metrics and performance.
Read the full article here




Leave a Reply