Analysis Summary
In today’s analysis, I will be covering Dow Inc. (NYSE:DOW), in the materials sector, subsector of commodity chemicals.
The Michigan-based company trades on the NYSE, and provides various materials science solutions for packaging, infrastructure, mobility, and consumer applications globally, according to its company profile.
This company produces the components of many products we use daily and may not even know it, and on a visit many years ago to the Texas coast I got to see firsthand the vast scale of the Dow Innovation Center there in Lake Jackson, along with miles of chemical plants stretching towards the Gulf Coast and employing thousands of local residents there.
One of its listed peers in the commodity chemicals sector is Westlake Corp (WLK).
For new investors jumping on this site, this company is not to be confused with Dow Jones, or the Dow index, which are completely different entities!
I gave this stock a buy rating, due to having more strengths in my review than offsetting factors.
Strengths: dividends, capital & liquidity, share price vs moving average, performance vs S&P 500.
Offsetting factors: valuation, revenue growth, net income & EPS.
A risk to my modestly bullish outlook that I identified is the legal cases and claims recently in the news related to this company, which I will discuss further.
My updated rating methodology as of October 2023 is to analyze the stock holistically across the following 7 categories of equal weight, and if it has more strengths than offsetting factors it gets a buy rating:
dividends, valuation, revenue growth, net income & EPS, capital & liquidity, share price vs moving average, performance vs S&P 500.
Dividends
In this section I will go over the dividend yield, dividend growth over 10 years, and dividend stability showing steady payouts. As a dividend-focused analyst and investor, I believe these are vital metrics to look at, and the data will be sourced from Seeking Alpha’s dividend data.
Though not all investors are dividend-oriented, I think it is an opportunity to generate regular cashflow from holding a stock longer-term.
First, let’s look at the yield, which is 5.43% as of this article, along with a dividend payout of $0.70 per share, on a quarterly basis.
Lately I have seen dividend yields past 5% more common to the financial sector and insurance, so the fact that a chemicals/materials stock has this high of a yield is worthy of being added to my “dividend quick picks” of the week.
However, if I were a new investor I just missed the most recent ex-date of Aug. 30th.
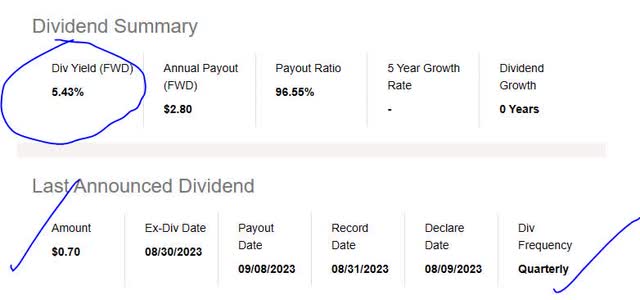
Dow – div yield (Seeking Alpha)
In comparison to its sector average, this yield is 143% above the average. I consider this a positive point and I think a reasonable dividend yield would be between 2% and 5% when considering the sector/industry.
With that said, a yield past 5% would be an attractive one at first glance but should warrant looking into whether the share price recently fell off a cliff and caused a spike in the yield, and later on in another section I discuss share price.

Dow – div yield vs sector (Seeking Alpha)
Next, I am looking at the 10-year dividend growth rate, shown in the chart below, which shows a trend of no growth for many years, followed by a spike in 2019 /2020, and then little to no growth.
I think that is a moderately negative point and I always look for a good dividend growth story to tell, backed by the data. The story here is a company that has not increased its returning of capital back to shareholders all that much, compared to some other companies.
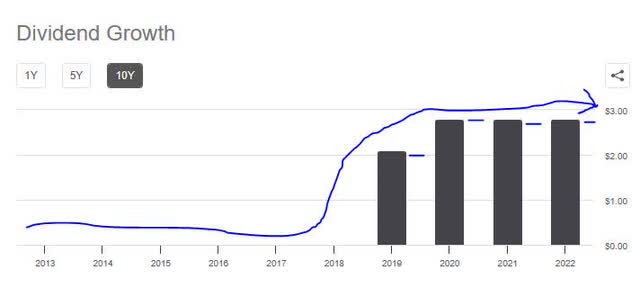
Dow – dividend 10 yr growth (Seeking Alpha)
Finally, I want to see dividend payout stability, especially since many of my readers rely on the stable dividend income that these types of stocks offer. Again, I think of it like investing into an existing cashflow stream without having to build the business from scratch on my own.
In looking at the table below, you can see stable payouts over the last few years, although with 0 dividend increases in this time period. If I was holding 1,000 shares, for example, I could realize $700 in quarterly cashflow from the dividends on this stock. (1,000 shares x $0.70 per share).
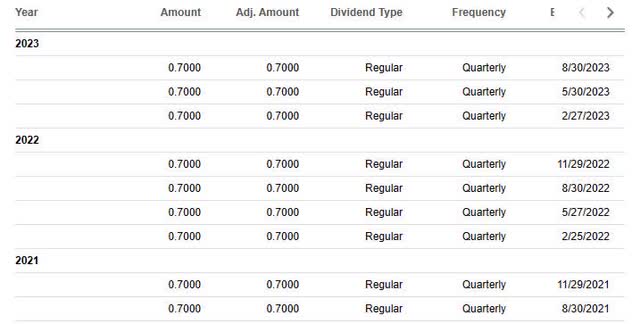
Dow – payout history (Seeking Alpha)
Based on the evidence, I consider the category of dividends a strength for this stock, as I think the lack of dividend growth is concerning but is offset by dividend payout stability and an above-average yield right now over 5%.
Valuation
To analyze the valuation, to simplify things I have chosen a single metric to focus on, and that is the price-to-earnings ratio (P/E), both the trailing and forward P/E, as it tells me what the market is pricing this stock at in relation to its earnings.
Although a higher-than-average forward P/E may indicate the market is having more confidence in the forward earnings potential of this stock, it also presents less of a value-buying opportunity, in my opinion.
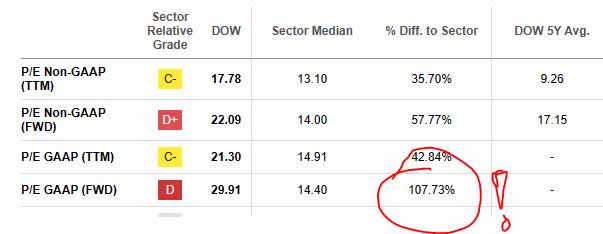
Dow – PE ratio (Seeking Alpha)
Considering that the TTM P/E of 21.30 is 43% above the sector average, and the forward P/E of 29.91 is 108% above the sector average, I consider this stock extremely overvalued compared to its industry, both on a trailing and forward basis.
Compared to its listed peer, Westlake Corp, that firm’s forward P/E of 13.59 is actually near 6% lower than the sector average. Just something to think about in your comparisons.
Based on the data, I think this valuation metric is an offsetting factor for this stock and I don’t see a good valuation opportunity on this stock right now.
Revenue Growth
Now, we’ve come to a topic I think many analysts & investors look at, which is the top-line revenue growth. Because this metric essentially shows money made before expenses & taxes, it does not indicate this firm’s effectiveness at managing costs, but at growing its revenue side of the house.
Manageable growth is important, in my opinion, because companies have competition and are striving to capture market share in their space.
For this company, we can see from the most recent quarterly results that it achieved a YoY decrease in total revenue. Not only that, but you can see a general downward revenue trend since June 2022, which does not add confidence to my sentiment.

Dow – revenue YoY growth (Seeking Alpha)
To help understand some of the headwinds facing the revenue side of the house, I turned to comments in the fiscal Q2 2023 earnings release:
Declines in all operating segments reflected lower demand and prices due to slower macroeconomic activity. Sales were down 4% sequentially, as volume gains were more than offset by lower local prices.
Volume decreased 8% versus the year-ago period, led by a 14% decline in Europe, the Middle East, Africa, and India (EMEAI).
Further, a key business segment for Dow, packaging & plastics, saw a significant drop in net sales. The headwinds identified were “lower ethylene and polyethylene prices across all regions driven by lower global energy and feedstock costs.”

Dow – packaging & plastics segment (company quarterly earnings release)
Overall, I think the data shows that top-line revenue YoY growth has been a challenge and is therefore an offsetting factor for this stock’s rating.
Net Income & EPS
I am separating the bottom-line data from top-line revenue, so net income & earnings per share get their own section here to make the analysis easier to understand.
What is interesting is that looking at the most recent quarterly results available, this firm achieved a YoY drop in net income and the basic earnings per share “EPS” decreased on a YoY basis.
From the table below, I can see that profitability has largely been depressed since Jun 2022, and a net loss was posted in March. While results have improved since then, I am waiting on more confident metrics going forward.
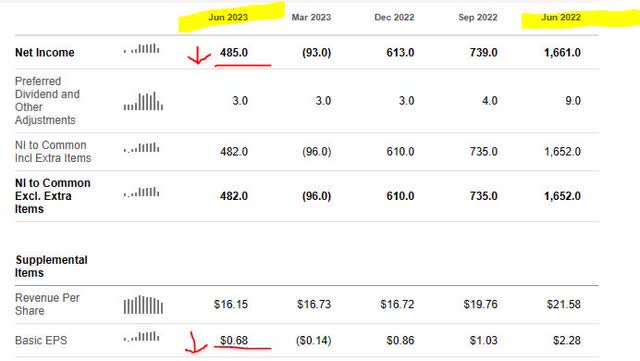
Dow – net income YoY (Seeking Alpha)
To get a sense of where the company sees its results going for the rest of the year, I turned to comments by CEO Fitterling:
Looking ahead, we will continue to execute our near-term cost savings actions and advance our longer-term strategic priorities as we manage through a macro environment that is expected to remain challenging in the second half of the year.
The actions we outlined in January are on track to deliver $1 billion of cost savings this year..
I think this company is on the right track on managing the cost side but has some ways to go in order to achieve YoY profitability gains, and so the category of net income & EPS is currently an offsetting factor for this stock’s rating.
Capital & Liquidity
In this section, we will focus on one or more fundamentals such as whether this company is well-capitalized, has positive equity, positive cashflow, and so on. I think these are important factors to consider and are among the very basics of any serious business.
From the following graphic, I can gather some critical info:
the company has $13B of liquidity from diversified sources such as cash, revolving credit, and bilateral credit lines.
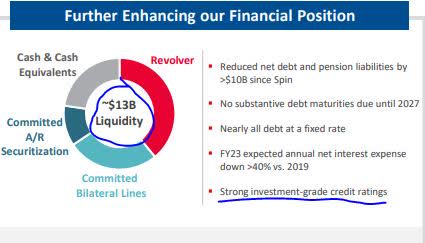
Dow – liquidity (company earnings presentation)
Further, I am looking at the following table that shows insights into the cashflow situation and it looks positive: after the most recent reported quarter (end of June) the company can boast free cashflow as well as positive free cashflow per share of $0.97. I think these metrics should matter to investors when considering a company’s fundamentals.
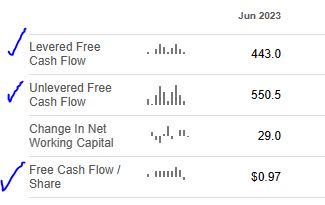
Dow – cashflow (Seeking Alpha)
From its balance sheet, the company ended Q2 with $2.9B in cash, $58.2B in total assets, $37.7B in total liabilities, leaving $20.5B in positive equity.
I think that the equity along with the cashflow definitely adds confidence that this is a serious firm and worthy of investment consideration in my portfolio.
Based on the evidence found, I consider this firm’s capital & liquidity situation a strength to its overall rating.
Share Price vs Moving Average
In this section, I am looking for a value-buying opportunity with this stock based on my updated portfolio strategy focused on trading crossovers below the 200-day simple moving average (“SMA”), when possible.
In my strategy, I am looking for a 5 to 10% drop below the 200-day SMA, after a period of bullishness, which I consider a buying signal. However, a price hovering around the moving average or a few points just above it may also present an opportunity.
To test my investing idea against potential capital gains & losses, I made a fictitious trading scenario.
So, let’s first take a look at the current price chart:
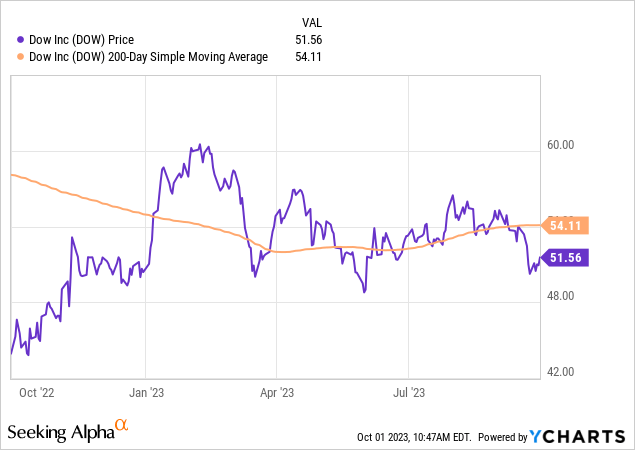
The share price as of the writing of this analysis is $51.56, which is 4.7% below the 200-day SMA of $54.11. At first glance, it appears that a crossover below the average has occurred already, and nearly 5% below the SMA which is my goal.
Using this scenario, I created a portfolio strategy that aims to limit exposure to unrealized capital losses (paper losses) with an eye towards effective risk management.
Using the chart above, I created the following trading simulation where I buy 100 shares at the current price and hold for 1 year, with a goal of achieving an unrealized capital gain at that time within a range of 5% to 20% or better.
At the same time, my maximum loss tolerance is an unrealized capital loss of 20%.
*Note: This analysis does not involve “realized” gains & losses, as they often open the door to taxable events, which is an entirely different topic I don’t cover.

Dow – trading simulation (author analysis)
In the above simulation, I am testing what gains/losses would occur if the future share price (in Oct. 2024) rises 15% above the current 200-day SMA, and also if it drops 15% below that same SMA.
The outcome? I am projecting unrealized capital gains of 20.69% and potential unrealized capital losses of -10.80%. Both outcomes are in line with my portfolio goals & loss tolerance since the projected loss is less than my 20% loss tolerance.
Here is a handy illustration of the above gain & loss scenarios and how they would look on the chart. As you can see, the current share price of $51.56 has a lot of upside potential if the future price hits my upper goal (blue arrow) in a year.
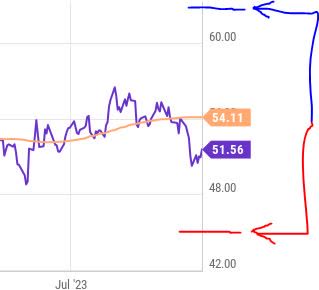
Dow – trading simulation – chart (author analysis)
The importance of testing both gains & losses, in my opinion, is that both can occur, which I know from experience. Actual results may vary, but think of this more like a simplistic framework to think about long-term investing and establish a risk tolerance and a profit goal, rather than trying to “time” short-term day-to-day price movements.
Based on this simulation, I think the current share price is a strength in my overall rating, and is within the zone for being a buying opportunity.
In the comments section, to cultivate a productive discussion I welcome your comments on the topic of your experience in trading crossovers and tracking moving averages?
Performance vs S&P 500
The following is a comparison of the 1-year price performance of this stock vs the S&P 500 index. I have included this metric in my updated rating methodology so as to compare this equity to a major market index that is tracked often.
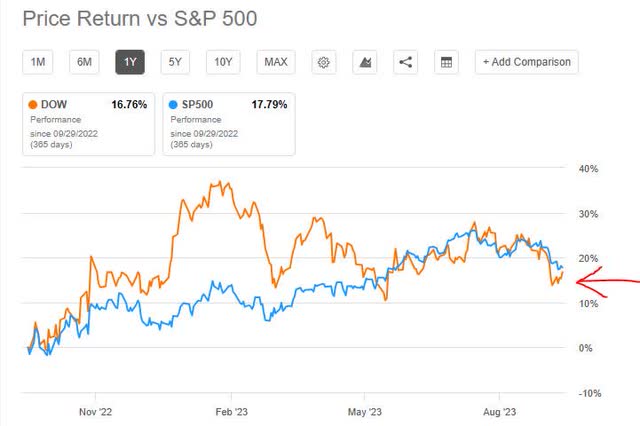
Dow – price performance vs S&P500 (Seeking Alpha)
I think that this data shows the stock only slightly underperforming vs this index, as of recently, with literally a 1% difference between the two.
In fact, as the chart shows it has been outperforming vs this index for quite a long time, and then the two being almost neck in neck with the S&P500’s price return being 17.8% in the 1-year period being tracked.
Another point to make is that this stock did not fall into the dip faced by financial-sector stocks this spring after a series of regional bank failures sent investors scrambling for the door on bank stocks.
I will go ahead and make the call that Dow’s price performance overall vs this index should be considered a strength and not an offsetting factor.
Risk to my Outlook
A risk to my modestly bullish outlook would be the following downside risk:
Let’s face it, Dow Inc. is in a very challenging business, much of which is producing, storing, shipping various materials and chemicals.. some of which can be toxic or dangerous. Because of this, this type of business is always at risk of environmental claims, lawsuits, and incidents.. and recent news stories could certainly cause investors to be bearish as concerns over mounting legal costs, fees, and negative PR can mount and add continuous costs to the company’s books.
One of these stories was a September article in Reuters discussing Norfolk Southern’s attempt to force Dow to pay part of the $500MM in chemical cleanup costs related to a derailment of a train carrying hazardous chemicals, a claim that Dow seems to be fighting.
Then, there is the recent story about the Louisiana Department of Environmental Quality seeking a settlement from Dow due to a decade of alleged violations. This came in the wake of a July explosion at one of Dow’s plants in that state.
However, while these are very real risks in this industry and are unfortunate for everyone involved when they do occur, my counterargument to bearish investors would be that a company with $2.9B in cash (as I have shown) will be able to absorb a handful of legal settlements that could occur, and keep in mind that often these cases take a while to be decided, and sometimes in Dow’s favor. What’s important is to let the judicial process do its job and verify all the facts of the case before making a decision.
Also, companies like this produce critical items used in a multitude of products, such as polymers, and its peers in the industry will face similar risks & challenges producing & storing potentially risky chemicals, so I don’t think it is something limited to only Dow itself.
In closing, my bullish sentiment on this stock remains and my buy rating stands, based on strengths I outlined outweighing the offsetting factors.
Read the full article here




Leave a Reply