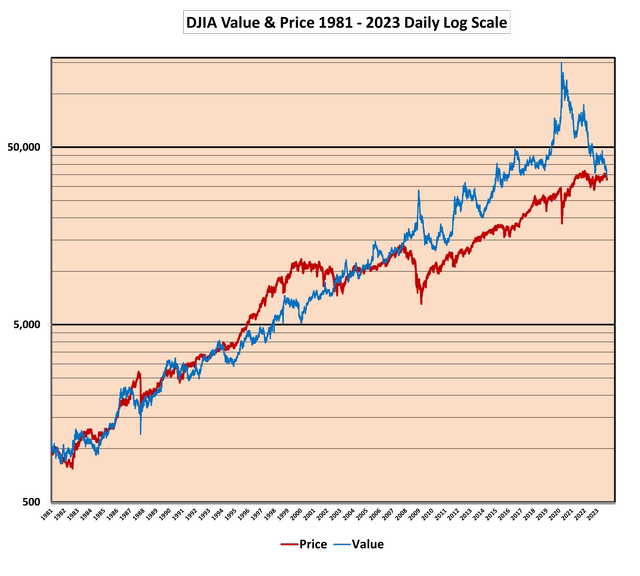
Bond Values and Prices are the same. Equity Values and Prices are not always the same. However, dividend and long bond yield changes explain 97% of the Global X Dow 30 Covered Call ETF (NYSEARCA:DJIA) price changes.
The yield of the 30-year T-bond has risen above the modified minimum yield of 4.5%. Indeed, the DJIA price is already discounting a 30-year T-bond yield of 5.05. At 6% it would drop to 27,825.
In a pamphlet entitled: Dow Jones – “Cheap as Chips” published in December 2021, I examined the relationship between the daily dividend discount value (DDV) of the DJIA and its price over the past four decades based on the actual 30-year T-bond yield, concluding that the DDV of the DJIA of 82,452, was over double its price of 34,022 putting it under tremendous upward pressure and had to be bought.
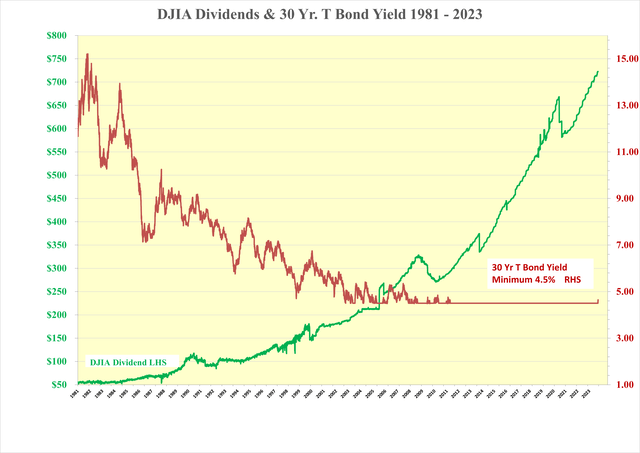
On August 15, 2008, the yield of the 30-year T bond fell below 4.5% and remained there for the first time in four decades. From that time on, the calculated DDV of the DJIA using the actual 30-year T-bond yield has exceeded the price of the DJIA. Sometimes by a considerable margin.

Dow Jones & FRED
The Dow Jones paper was published before the start of the Ukraine war, the resulting hike in the price of energy, the end of Covid, the supply chain issues, the rapid acceleration of inflation, the resulting increases in short-term rates by central banks and the free-market impact on the 30-year T-bond yield.
As per Milton Friedman’s brilliant dictum, the massive expansion in the money supply over the past 15 years has finally unleashed inflation. “Inflation is always and everywhere, a monetary phenomenon. It’s always and everywhere, a result of too much money, of a more rapid increase in the quantity of money than an output.”
This looks like the start of a replay of the 1960s “Guns and Butter” policy during the Vietnam War, the 1970s oil price shocks, and the futile attempts at “Wage and Price Controls” resulting in Stagflation. What did well in the 1970s after OPEC 1 were hard assets such as real estate, commodities including gold and base metals along with the shares of companies which produced the same.
Since Lehman until the invasion of Ukraine, both short-term and long-term sovereign rates have been extraordinarily low, with some even negative. This situation was never expected to continue ad infinitum even though the bond bulls tried very hard on March 9, 2020, when the closing yield of the US 30-year T-bond hit 1.00% after an intraday low of 0.5%. These low rates pushed up the DDV of the DJIA to 150,000 and 300,000 respectively. Abject panic was the order of that day. Equities were clearly out of favor, while T-bonds benefitted from a flight to safety. Wrong move!
By March 23, 2020, the 30-year T-bond yield rebounded to 1.31% while the DJIA price fell further to 18,592, yielding 3.51% bringing the DDV back down to 115,000. This demonstrated the huge asymmetrical leverage of small absolute changes of the 30-year T-bond yield with increasingly large percentage changes as zero is approached.
On October 5, 2023, the closing price of the DJIA, at 33,130, down 900 points over the past 22 months. A relatively small amount compared to the DDV of the DJIA, which has collapsed from 82,452 to 34,401, still above its price of 33,150. The 30-year T-bond yield increased by 179% from 1.74% to 4.86% dragging the DDV down. On the positive side, the DJIA dividend has moved up, but by a much more modest 17% from $621.06 to $723.76. It would have been even higher but for the elimination of three heavy dividend payers, including Exxon Mobil, from the index in the interim.
Post Lehman, the price of the DJIA has not moved in line with its calculated DDV based on the actual 30-year T-bond yield. Unlike the bond market, where price and value are always the same, it appears that the collective psyche of equity market participants was to eschew the belief that low and falling interest rates would continue forever. The result of too much money chasing safety and yield in a time of COVID-19. A manifestation of fear showing up, perhaps, as a deep desire for a return of capital rather than a return on capital.
What 30-yield T-bond yield was the equity market discounting?
If such low long-term rates were indeed unsustainable, what should they have been? The history of British Consols provides some guidance as to what buyers were satisfied with in times of either low or no inflation. The last British Consol was issued in 1923 with a 2.5% coupon. In 1981, it traded at GBP 15, yielding 16.7%. It was finally redeemed at par in 2015, an excellent investment for any 1981 buyer who held till redemption.
An allowance for longer-term inflationary expectations must be added to this assumed basic rate of 2.5%. On September 29, 1981, the yield of the 30-year T-bond peaked at 15.20% implying an anticipated inflation rate of 12.70%, demonstrating, yet again, mankind’s amazing propensity for projecting the most recent trend ad infinitum.
The stated desire of the main central bankers is to bring inflation down to a long-term level of 2%. This was, ironically, the same level, that the same bankers wanted inflation to rise to since Lehman until the end of Covid and the start of the Ukraine war. This suggests that it would be reasonable to use a 30-year T-bond yield of at least 4.5% with which to calculate the DDV of the DJIA rather than the actual yield until the 30-year T-bond yield rises above the 4.5% level, as it is today.

Dow Jones & FRED
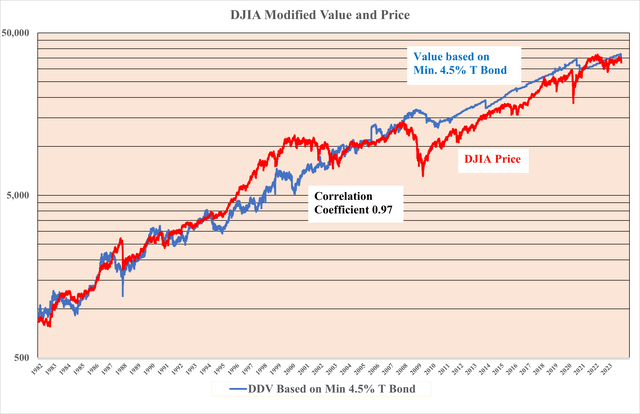
The two dominant vectors in the DDV equation are dividends and the 30-year T-bond yield. The following chart uses a modified minimum 30-year T-bond of 4.5% and the actual DJIA dividends.
This modification provides a much better fit with a correlation coefficient of 0.97. The value of the DJIA using a 30-year T-bond yield of 4.86% at 334,401 remains above the October 5, 2023, closing price of 33,130. This suggests that the pressure on the price of the DJIA remains modestly upward. However, the potential for the 30-year T-bond yield to move rapidly higher will result in a sizable reduction in the DDV of the DJIA that has not been in evidence since Lehman, with the actual 30-year T-bond yield having been below the modified minimum 30-year T-bond yield of 4.5%.

Dow Jones & FRED
The price of the DJIA, at 33,130 is at a 4% discount to its DDV of 34,401 using a 30-year T-bond yield of 4.86%.
Where do we go from here? Stand Well Back from the Falling Sword!
1. Since Lehman, the 4.5% minimum modified DDV of the DJIA has only been impacted by changes in the dividend of the DJIA and not, until now, by the rising 30-year T-bond yield.
2. Between October 9, 2007, (the peak of the last bull equity market) and October 5, 2023, the dividend of the DJIA has risen by 149% while the DDV has risen by 150% to 34,401.
3. The reason for this is that the 30-year T-bond yield has been held steady at a minimum of 4.5% since Lehman, hence the only moving part in the DDV equation has been the DJIA dividend.
4. Any increase of 30-year T-bond yield above 4.5% will begin to have an increasingly significant negative impact on the DDV of the DJIA
5. On October 5, 2023, the 30-year T-bond yield rose to 4.86% and the DDV fell to 34,401.
6. While a higher DJIA dividend would offset a rising 30-year T-bond yield, it is highly unlikely to be sufficient in the near term.
7. The current earnings recession has seen DJIA earnings fall 24% from $1,790.18 on February 25, 2022, to $1,367.00 today. Dividends have risen by 14% from $636.16 to a record $723.76 which has been modestly positive for the DDV.
8. Over the same period, the DJIA dividend payout ratio has risen from 36% to 53%, which is well below its four-decade average of 63%. This suggests that the dividend is safe and has some room to rise further even without any earnings recovery. However, not enough to offset the ongoing rapid rise of the 30-year T-bond yield.
Read the full article here


Leave a Reply