Investors,
For the second quarter of 2023, Deep Sail Capital Partners (the “Fund”) returned -23.3% net of fees while averaging 78% net long exposure. Year-to-date through June, the fund returned 21.3% net of fees while averaging 85% net long exposure. Please consult your individual capital account statements for your individual net returns.
|
Performance Summary |
Net Returns |
Deep Sail Capital Vs Benchmark |
||||
|
Q3 |
YTD 2023 |
Strategy Since Inception * |
Q3 |
YTD 2023 |
Strategy Since Inception* |
|
|
Deep Sail Capital Partners LP |
-23.3% |
-7.5% |
43.3% |
|||
|
Russell 2000 |
-5.1% |
2.5% |
58.2% |
-18.1% |
-10.0% |
-15.0% |
|
Russell Mid Cap Growth Index |
-2.4% |
9.9% |
82.6% |
-20.9% |
-17.3% |
-39.3% |
In the third quarter, the fund underperformed our benchmarks, the Russell 2000 index (RTY) and the Russell Mid Cap Growth Index. The long portfolio performance was driven by both general weakness in micro- and small-cap equities and a few companies in our quality portfolio that saw material growth decelerations. I will discuss the growth deceleration of these positions in detail below in the long portfolio summary. The short portfolio was slightly negative for the quarter, driven by what I described in our 2Q Investor Letter as a “mini re-bubble” in low-quality, long-duration equities. There are still several short positions impacted by this bubble, which we believe will slowly deflate over the next 6 months.
Market Commentary
In my recent market commentary, I have spent most of the last year talking about the coming recession, often saying it is coming but not here yet. That trend continues to be the case this quarter. Although I wouldn’t put a recession yet as a near certainty, I would say we have inched a bit closer to it over the last quarter. The economic situation continues to be driven by the main forcing factor in the economy, the US federal reserves fed funds rate. Higher Fed funds rates continue to push on the economy, driving down housing, construction, funding availability, and general risk-taking activity. Inflation, while potentially short-term tamed, has creeped into the cost of everything, with the public increasingly noticing the inflation burden on their spending. The excess savings that were built up during COVID are nearly gone. The situation is much closer to a recession than at any point since the onset of COVID.
With that all said, there is no real panic taking place, nor is there any real reason to expect to see one. There is no singular structural issue like the excessive consumer mortgage exposure we saw before the GFC that will erupt and take the economy into a global financial crisis. The current economy is rather ripe, with several smaller cyclical issues. Consumer balance sheets are in the best place they have been in decades, and jobless claims remain near an all-time low.
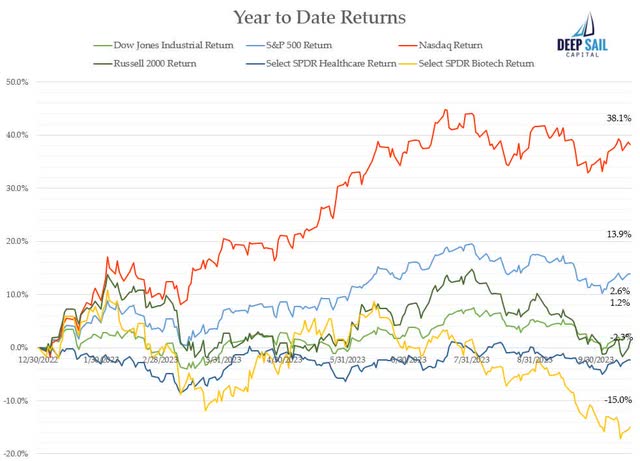
While the overall market indexes have held up well this year, they’ve mostly been driven by a few of the largest companies. The so-called “Magnificent Seven,” which includes the S&P500 (SP500, SPX) heavyweights Microsoft (MSFT), Apple (AAPL), Alphabet (GOOG, GOOGL) , Amazon (AMZN), Tesla (TSLA), META Platforms, and Nvidia (NVDA), have returned on average 97% year to date. The rest of the market, on the other hand, has seen significant pain, most notably in the small-cap space. Specific sectors have seen massive selloffs that could be considered historic, including biotechnology and medical devices. For those not paying close attention to individual mid- and small-cap stocks, they may not have noticed, but there has already been a lot of selling pressure within the market. I believe this selling pressure has taken place partly because of fears of a coming recession. Below is a summary of the year-to-date returns of the major indexes and the SPDR Series Trust, SPDR S&P Biotech ETF (XBI), which clearly shows a lot of pain within the market not reflected in the indexes.

Long Portfolio Summary

In the third quarter, the long portfolio’s performance erased all of the fund gains from the previous two quarters. There were several negative-performing positions in the fund in the third quarter as the overall small and microcap space saw material weakness. The fund saw specific sector weakness in the healthcare segment as the biotechnology industry saw an overall slump due to a reduced biotech funding environment and worries about the implications of the Inflation Reduction Act on long-term drug pricing. I believe these are largely near-term impacts and a one-time reset in the forward biotechnology progress globally. Outside of these industry- and small-cap-specific drivers, the other major impact on the fund in Q3 was a few growth decelerations that came as a surprise to investors, including myself.
Unexpected growth deceleration is potentially the worst outcome for many high-growth stocks, like the ones that the fund invests in. Our three worst detractors in the quarter were Adyen (OTCPK:ADYEY), Aritzia (OTCPK:ATZAF), and Biolife Solutions (BLFS), which all experienced a revenue growth deceleration in the third quarter. The worst detractor in the quarter was Adyen, which reported in August that the first half of the year’s revenues were up 23% YoY, which was lower than their mid-term guidance of 25–35% revenue growth. This deceleration came at a bad time for Adyen, as they just completed a large hiring effort in the first half of 2023 that drove up their expenses as well, causing a larger negative margin impact. The main drivers of the growth deceleration were economically driven by their customers choosing to cut costs and adopt cheaper payment processing options than Adyen. Most of Adyen’s high-volume customers have multiple processing partners, with Adyen being the highest quality across most countries but also the most expensive payment processor. This makes them susceptible to switching from these large, high-volume customers. Adyen has realized this vulnerability, which is why they are pushing significantly into the midmarket through their platforms and marketplace offerings. Adyen is still the best-in-class payment offering, with a bottom-up-built platform and a top management team that manages for the long term. On top of that, Adyen still has several new business opportunities in front of them that are very early in development, like Treasury and Platforms.
The fund added to its position in Adyen recently at a very attractive valuation of 17x EV/EBTIDA on an NTM basis.
In Q3, we closed six positions and opened a total of four new positions. On the microcap side, we opened positions in Creative Realities (see thesis below), Sanera Medtech, and Mitek Systems. On the quality side, we opened a position at InMode, an medical RF device manufacturer and marketer that we believe will see a tailwind from GLP-1 adoption in the next few years.
Current Position: Creative Realities (CREX)
Creative Realities is a digital signage installer and digital signage software operating system.
Creative Realities has completed two major acquisitions since 2019 (Reflect Systems in 2022 and Allure in 2019) to build a digital signage software offering that includes a robust suite of software for managing digital signage. Creative Realities offers software solutions, including ReflectView for digital signage management, Clarity for digital menu board management, and Reflect AdLogic for managing advertising on digital signage. Creative Realities has historically only sold their software on screens that they install, but that is beginning to change. Due to the breadth and quality of their software offering, they are beginning to ramp up a channel sales program to allow other digital signage installers to offer their software. This will likely begin as a very small opportunity for Creative Realities, but the gross margins on their software sales (likely ~70–80 margins) are much higher than their core hardware sales (~40%), so from a business model perspective, it could be transformative.
The current SaaS business is operating at an annual recurring revenue (ARR) of $15.2 million as per the Q2 earnings report, which has been steadily growing over the past few quarters. As they install new sites, their software ARR will continue to grow, with around 5% of the spend from installation converting into increasing software ARR. If they can deliver $120 million of backlog installations over the next two years, their ARR should be over $20 million per year at the end of the period. Outside of the normal ARR from software operating licenses, they have several areas in which they can expand their ARPU per installed display, including content design, ad delivery, and interactive functionality.
Market Opportunity – Segments
Creative Realities operates in two segments: hardware sales and services and software. Hardware sales include all of the display sales and installation costs associated with installing new digital displays. Services and software sales include engineering, design, content, ad exchange fees, and software licenses via a SaaS model. The hardware business is largely a commodity business, as they are simply resellers and installers of the OEM’s hardware. The services and software business is the higher margin portion of the business, which is where the company is planning to gain leverage in their business model. The entire services and software business operates at a 60% gross margin, but we estimate that the SaaS portion of this business operates at a very high gross margin of 70–80%.
The space for digital signage is a highly competitive business, but within each category, the competition differs. For example, in digital menu signage, Creative Realities competes largely with smaller local or regional digital signage installers, but in retail or entertainment signage, they compete with larger competitors like Stratacache and MagicInfo. Creative Realities is a top 10 digital signage installer (7th by licenses) based on industry research the company provides from the Invidis 2023 Yearbook. The company’s offering has all the elements of a complete offering, including installation, design, operating software, and an advertising platform. Their complete solution has contributed to significant customer wins in the last 24 months. In 2022 and 2023, the company won three major customers: Panera Bread, Starlight Media, and Strike Ten Bowling/Bowling Proprietors Association of America (BPAA). These deals are a significant win for the company and highlight their total offering strength. In terms of the number of digital displays for each win, Panera is forecast at 2,000 sites, Starlight Media is forecast at up to 6,000 media assets, and the Bowling deal will evolve over time, but expectations are at least 250–500 sites. These three larger deals will be delivered over the course of the next few years, with the bowling delivery just starting in October of this year after a significant delay due to third-party equipment delays. The current backlog of the company is $120 million, which they believe they can deliver on over the next two years.
Recent history: Merger, Buyout offer, and Equity Raise
2022 and 2023 has been a very eventful two years for Creative Realities. Here is a quick summary:
February 2022: The company completed an acquisition through a merger with Reflect Systems, which brought together their current software offering. The purchase price for the Reflect acquisition was $35 million, which was paid for via a mix of cash (raised via equity issuance prior to closing) and equity in Creative Realities.
January 2023: Creative Realities was forced into a 3 for 1 reverse stock split in order to meet the Nasdaq minimum bid price requirements.
February 2023: The existing largest shareholder of the company’s equity, Pegasus Capital Advisors, sent the company an unsolicited bid for the company at $2.43 per share.
March 2023: The Creative Realities board rejects Pegasus Capital’s first unsolicited bid at $2.43 per share as they believe it underprices the current backlog and coming revenue and free cash flow ramp from the recent major customer wins. The company increased revenue guidance for 2023 to exceed $60 million.
May 2023: The Creative Realities board rejects Pegasus Capitals second unsolicited bid at $2.85 per share.
August 2023: Pegasus refuses to re-negotiate a ~$7 million amortizing note. Creative Realities, seeking to secure all needed cash until they turn the corner to FCF-positive, raised cash from selling 3 million shares at $2 per share.
October 2023: Shares trade down to their lowest level ever of $1.35. Creative Realities confirms revenue will be within guidance for Q3 2023 and reiterates their $60–80 million revenue guidance for the next 12 months. Shares trade up to $1.75.
Creative Realities – 4 Pillars of an Exceptional Investment:
|
Pillar |
Rating |
Comments |
|
Pillar 1 – High Quality Business Model |
B + |
• The core display installation business is relatively commoditized and competitive. Gross margins in this business are likely stable at around 40% but barely cover the company’s overheads. |
|
• The SaaS offering is completely unappreciated by the market. This is an incredibly sticky business, with almost zero churn due to the fact that the operating system is essential to running the digital assets. |
||
|
• The SaaS business is steadily growing at a 70–80% gross margin, and there are huge opportunities to sell their software through other third-party installers (channel partners) as well as through advertising and interactive upcharges. |
||
|
Pillar 2 – Exceptional Management |
C+ |
• Recent equity issuance and missteps in their dealings with their largest equity and debt owner, Pegasus Capital, do not reflect well on management. Both the CEO and the CFO did participate in the equity offering, suggesting they believe the stock is cheap at these levels. |
|
• I do respect them for shooting down the Pegasus Capital takeover bid, as I too believe it underpriced the equity in the company. |
||
|
• A solid combination of an excellent salesman in CEO Rick Mills and an excellent finance mind in CFO Will Logan |
||
|
Pillar 3 – Substantial Long Term Growth Prospects |
A- |
• The company has done most of the difficult work of putting together a full software offering and selling that to a few large customers. At this point they just need to execute on delivering on those deals. |
|
• Software offering as multiple points of optionality, including channel partner sales, up sales on advertising and interactive functionality. |
||
|
• The digital display industry is still very early in its progress to convert billboards, menu boards, and other media devices over to digital, with the industry forecasted to growth at a 15-20% for the next decade. |
||
|
Pillar 4 – Reasonable Valuation |
A+ |
• EV/EBITDA for NTM = 4.4. Revenue Growth +50% over the next 12 months. |
|
• As their SaaS business scales to a larger portion of revenues their Gross Margins will expand from low 40% up towards 50% |
||
|
• The company is forecasting they will be FCF positive in Q4 2023 or Q1 2024. They believe there is little incremental investment required to scale the business on a go forward basis. |

Conclusion
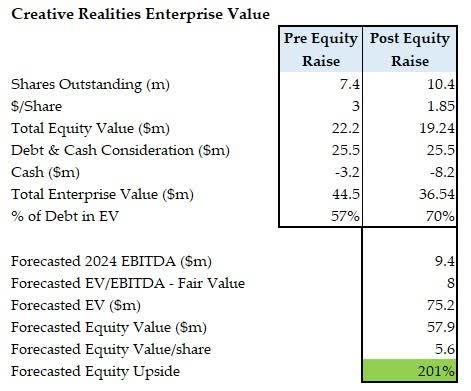
Creative Realities is a unique situation in which the company has built a solid platform for their industry vertical and sold that offering to major customers. All that is waiting for the company now is to execute on those sales, which are largely based on them getting access to sites and availability of third-party equipment. The stock is extremely cheap at this level, trading at 4.4x EV/NTM EBITDA estimates. The company has a sizable portion of their EV in debt, providing the equity significant upside if they can deliver.
We currently believe the business is worth $5.6 per share or a 201% upside to the current market price of $1.85 per share, which rests purely on them delivering on already sold projects and considers no new major sales wins or the potential to expand their software business through channel partnerships.
Short Portfolio Summary

As described previously in our Q2 investor letter, there was a mini-rebubble that occurred starting in Q2 in long-duration, low-quality stocks. This mini-rebubble is centered around artificial intelligence (AI), electric vertical take-off and landing (EVtol) aircraft, and some leftover SPAC pumps from the last cycle. We believe this mini-rebubble has already burst, just like all the other bubbles that we have traded before (3D printing, electric vehicles, cannabis, etc.). It is already in the process of deflating, but we expect that to continue for the next few quarters. We anticipate that the opportunities in the short portfolio are beginning to run thin as the bubble deflates and many individual equities are nearing their technical bottoms. We are cautiously positioning the short portfolio here, trying to be very mindful of potential short squeezes.
Our best-performing short position in the quarter was in C3.AI (AI), one of the equities that entered a mini-bubble in late Q2. Our worst-performing short position was Ehang Holdings (EH), which saw significant upside from EVtol excitement and exhibited squeeze dynamics in the quarter. We seek to avoid these types of squeezes and are attempting to be nimbler in our short positioning at these levels.
Top Holdings & Current Exposure

At the end of the third quarter the fund held 22 long positions and 21 short positions. The fund ended the quarter with an exposure of 127% long and 38% short or an 89% net long exposure.
Sincerely,
Sean
|
Disclaimer Deep Sail Capital LLC (“Deep Sail Capital”) is an investment adviser to funds that are in the business of buying and selling securities and other financial instruments. This information is provided for informational purposes only and does not constitute investment advice or an offer or solicitation to buy or sell an interest in a private fund or any other security. An offer or solicitation of an investment in a private fund will only be made to accredited investors pursuant to a private placement memorandum and associate subscription documents. Past performance is no guarantee of future results. “Deep Sail Capital Partners” returns in this document are shown as net returns or gross returns where stated. Historical net returns assume a 1.5% and 15% management and performance fee, respectively. For Net Returns of fees and expenditures figures please reach out to the fund manager at the email info@deepsailcapital.com. “Deep Sail Capital LLC” name was changed on April 7th 2022 from the previous name “Organon Capital LLC”. “Deep Sail Capital Partners LP” name was changed on April 6th 2022 from the previous name “Westropp Funds LP”. * – “Strategy Since Inception” refers to the Strategy inception date of July 2016. Deep Sail Capital Partners LP’s predecessor incubator fund, “Westropp Funds LP” pivoted from a Value Investment style to a Growth at a Reasonable Price (GARP) style fund on that date. For more details on this transition or the calculation behind the “Strategy Since Inception” returns please reach out to the fund manager at info@deepsailcapital.com. |
Original Post
Editor’s Note: The summary bullets for this article were chosen by Seeking Alpha editors.
Editor’s Note: This article discusses one or more securities that do not trade on a major U.S. exchange. Please be aware of the risks associated with these stocks.
Read the full article here


Leave a Reply