
By Erica Furfaro & Margaret Vitrano
Insurance Offers Resilience Through Downturn
Market Overview
A stall in the mega cap growth trade occurred in the first quarter as the chaotic introduction of tariffs accompanied by fears of a slowing U.S. economy and higher inflation sent stocks to their worst quarterly showing since the 2022 bear market. The S&P 500 Index (SP500, SPX) declined 4.27% while the growth-laden NASDAQ Composite (COMP:IND) tumbled 10.42% and the benchmark Russell 1000 Growth Index (RLG) fell 9.97%.
Trump’s actions to reorder global trade dominated headlines in his first three months in office, sending the S&P 500 and most U.S. growth indexes into correction territory. The RLG underperformed the Russell 1000 Value Index by over 1,200 basis points. Through March, the U.S. had imposed 25% steel and aluminum tariffs, an additional 20% tariff on China, plus 25% tariffs on most goods from Canada and Mexico not covered by a previous trade deal, with more sweeping levies expected to start the second quarter.
Tariffs were just one of the headwinds impacting the Magnificent Seven as all except Meta Platforms (META) underperformed the index. The surprise emergence in January of DEEPSEEK, a Chinese large language model (LLM), with capabilities similar to the best LLMs but built with inferior chips and at a lower cost, caused investors to question whether the massive capex being devoted to Gen AI would continue. Shares of Nvidia (NVDA), supplier of the most advanced GPU chips to power AI applications, fell sharply despite Nvidia continuing to deliver record financial results amid a strong rollout for its newest Blackwell GPU system.
Exhibit 1: The Divergent Seven
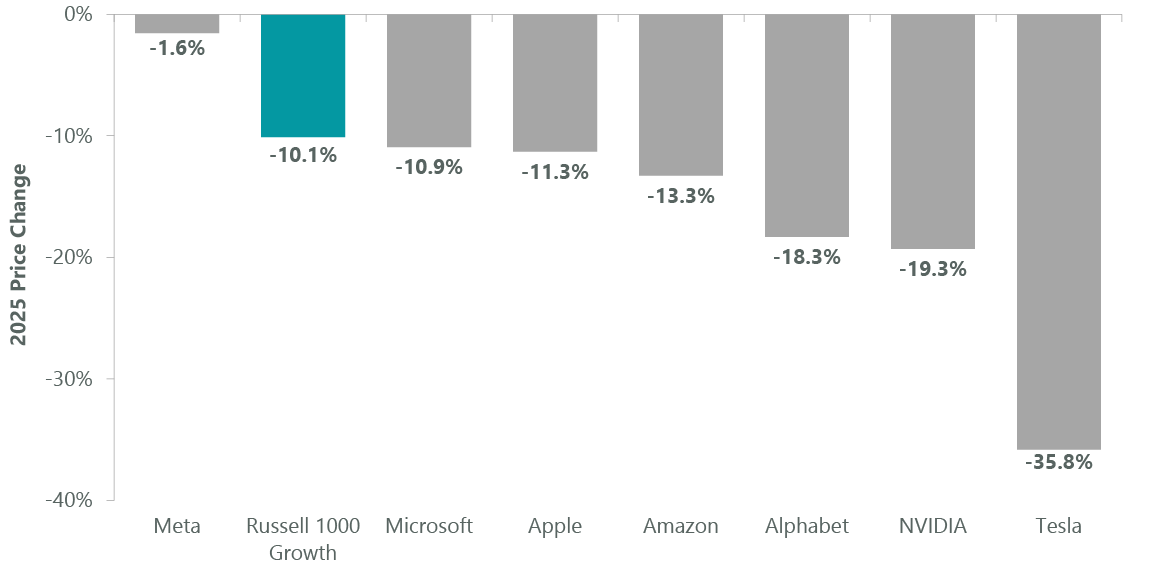
Price returns as of March 31, 2025. Source: FactSet.
The ClearBridge Large Cap Growth Strategy held up better than the benchmark through this reversal (on a gross basis), aided not only by its underweight to the Magnificent Seven and the information technology sector but also strong stock selection across IT, communication services and financials.
Our active underweight to the Magnificent Seven added more than 100 basis points to relative returns for the quarter, with underweights to EV maker Tesla (TSLA) and Google (GOOG,GOOGL) parent Alphabet being among the largest relative contributors. We added to both positions, taking advantage of what we view as short-term weakness as Alphabet missed high expectations for cloud revenue growth in its latest quarter, while Tesla worked through negative sentiment over CEO Elon Musk’s role in the Trump administration.
An important but often overlooked component of our diversified approach is adding what we view as “insurance” to the portfolio through the ownership of lower-beta names that tend to hold up well in downturns. In this category, commercial insurance broker Marsh & McLennan (MMC), exchange and financial data provider S&P Global (SPGI) and paint and coatings maker Sherwin-Williams (SHW) delivered positive returns during the quarter.
Portfolio Positioning
We continued our “moving to the middle” approach to portfolio construction by taking some profits to reduce our health care overweight and leveraging recent volatility to deploy the proceeds into IT, where the Strategy remains underweight the benchmark by ~1,000 bps. We believe these actions leave the portfolio well positioned as economic growth is expected to slow and earnings growth broadens across the spectrum of growth companies we target.
The purchase of Synopsys (SNPS), a leader in electronic design automation (EDA) software and custom chip designs, was the most significant change to our IT holdings. Synopsys is a software provider that operates in a duopoly market with multiple avenues of growth driven by increased complexity of semiconductor chips. The company’s EDA software and tools are mission critical and difficult to replicate, providing defense to its high-margin business model. The stock has lagged over the past year as the recent wave of AI infrastructure spending has not yet accelerated its revenue growth. We think this is driven largely by softness in the cyclical portions of the semiconductor market and that Synopsys remains well positioned to benefit from AI infrastructure spending and increasingly complex chip design. Also in IT, we added to tax and accounting software maker Intuit.
To help fund these additions, we exited our position in Alcon (ALC), a medical device company focused on eye care products and solutions for surgical procedures and consumer use, and Intercontinental Exchange (ICE), an operator of securities exchanges and provider of fixed income, data services and mortgage technology solutions. We purchased Alcon in 2020 after surgical disruptions due to COVID-19 created a unique buying opportunity. At the time, Alcon had major positive cycles in both of its core businesses as well as the opportunity to expand margins by investing in new manufacturing and leveraging its commercial investment. We sold down the position gradually as the stock approached what we viewed as fair value. Similarly, we sold ICE as the stock has re-rated higher due to expectations for positive change in housing fundamentals supporting its mortgage business.
Outlook
As a large cap manager, the multinational exposure of many of our holdings makes tariffs a key risk we are monitoring. Tariffs could be a headwind to GDP growth with the size of that headwind in the short-term depending on substitutes, ease of shifting production and consumer elasticity of demand. We have examined what happened in 2018 when tariffs were put in place as a guide. In certain sectors like the auto parts, costs were passed on to the consumer and the auto parts retailers did just fine. In other cases, tariffs put in place on China caused companies to shift production to other parts of Asia.
One way that we have evaluated current tariff risks is by gauging our exposure compared to our peer group and the RLG. Generally, the Strategy has lower tariff exposure than the benchmark. Revenue of our portfolio companies sourced from China was close to 8% at the end of 2024 compared to about 10% for the index. Overall revenue outside the U.S. was about 45% compared to 48% for the index.
Exhibit 2: Portfolio Revenues by Country
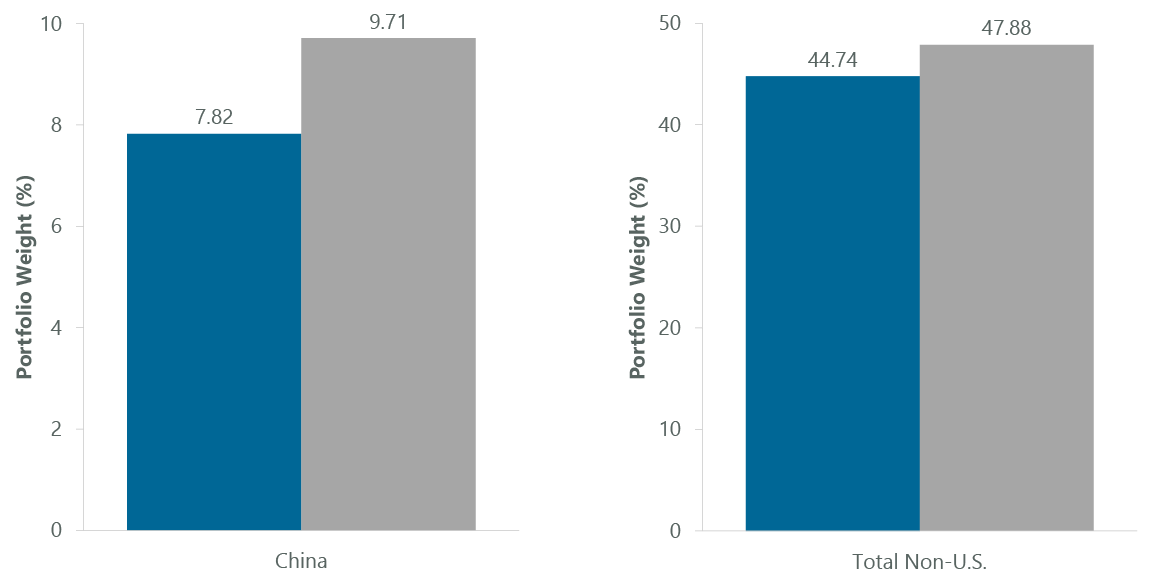
As of March 31, 2025. Source: FactSet
Drilling further down, we have been engaging with management teams of portfolio companies with production outside the U.S. to understand supply change fungibility and the ability to pass through costs to end customers. We are specifically monitoring risks to the consumer sector from tariffs because consumers have already borne the burden of several years of cost inflation pressuring wallets and some areas of spending, like dining outside the home, have easy substitutes. That said, beverage holdings Starbucks (SBUX) and Monster (MNST) both held up well during the quarter. Starbucks is undergoing an earnings reset under new CEO Brian Nicoll that is being well received by investors. Monster, meanwhile, benefited from price increases and strength in its international business.
We see companies like these and our other holdings outside the Magnificent Seven starting to deliver better earnings growth. We have positioned the portfolio in anticipation of this broadening out in the market. Barring a recession, in 2025 we expect to see earnings growth from industrials and health care companies narrowing the gap to earnings growth compared with the technology universe. While we have entered a period of heightened uncertainty, the general health of the economy entering this phase of the cycle is strong. We are moving into an environment where we expect to lean on growth from multiple angles, not just the rapid revenue growth we have seen out of the mega caps but also companies inflecting higher due to better margins or improved earnings.
Portfolio Highlights
The ClearBridge Large Cap Growth Strategy outperformed its Russell 1000 Growth Index benchmark in the first quarter. On an absolute basis, the Strategy delivered positive contributions across three of the nine sectors in which it was invested (out of 11 sectors total). The primary contributor to performance was the financials sector while the IT and consumer discretionary sectors were the main detractors. Relative to the benchmark, overall sector allocation and stock selection contributed to performance. From a sector allocation perspective, overweights to health care, industrials and financials and an underweight to IT supported results. From a stock selection perspective, strength in communication services, IT and financials offset weakness in health care, real estate and consumer staples.
On an individual stock basis, the leading absolute contributors to performance were Visa (V), UBER, RTX, Marsh & McLennan and Monster Beverage. The primary absolute detractors were Nvidia, Amazon.com (AMZN), Microsoft (msft), Tesla and Apple (AAPL).
Erica Furfaro, Managing Director, Portfolio Manager
Margaret Vitrano, Managing Director, Portfolio Manager
|
Past performance is no guarantee of future results. Copyright © 2025 ClearBridge Investments. All opinions and data included in this commentary are as of the publication date and are subject to change. The opinions and views expressed herein are of the author and may differ from other portfolio managers or the firm as a whole, and are not intended to be a forecast of future events, a guarantee of future results or investment advice. This information should not be used as the sole basis to make any investment decision. The statistics have been obtained from sources believed to be reliable, but the accuracy and completeness of this information cannot be guaranteed. Neither ClearBridge Investments, LLC nor its information providers are responsible for any damages or losses arising from any use of this information. Source: London Stock Exchange Group plc and its group undertakings (collectively, the “LSE Group”). © LSE Group 2025. FTSE Russell is a trading name of certain of the LSE Group companies. “Russell®” is a trade mark of the relevant LSE Group companies and is/are used by any other LSE Group company under license. All rights in the FTSE Russell indexes or data vest in the relevant LSE Group company which owns the index or the data. Neither LSE Group nor its licensors accept any liability for any errors or omissions in the indexes or data and no party may rely on any indexes or data contained in this communication. No further distribution of data from the LSE Group is permitted without the relevant LSE Group company’s express written consent. The LSE Group does not promote, sponsor or endorse the content of this communication. Performance source: Internal. Benchmark source: Standard & Poor’s. |
Original Post
Editor’s Note: The summary bullets for this article were chosen by Seeking Alpha editors.
Read the full article here