By Scott Glasser, Michael Kagan, & Stephen Rigo
Seeking Nature-Positive Revenue Opportunities
Market Overview
Despite a strong start in July, the S&P 500 Index (SP500, SPX) finished the third quarter down 3.3% as momentum fizzled in August and September. The most likely explanation for the drop was the relentless increase in interest rates. 10-year U.S. Treasury yields broke above their October 2022 highs in early August, then surged above 4.5% by quarter end. Even with strong earnings reports, Microsoft (MSFT) modestly underperformed the market and Nvidia (NVDA) managed only a marginal gain, suggesting equity markets may have valued fully the near-term generative AI opportunity. The higher dollar and threats to consumer spending from higher oil prices and the end of the student debt repayment moratorium also weighed on returns.
During the third quarter only two sectors advanced in absolute terms: energy and communication services. Energy stocks rose 12% on the tailwind of an increase in the price of oil from $70 to $90. Communication services stocks posted a much more modest +3% return but hold the distinction of being the only sector to outperform the S&P 500 in all three quarters of 2023. Traditional media stocks contributed to the sector’s relative outperformance while digital advertising and AI momentum drove continued outperformance at Alphabet and Meta Platforms.
Of the nine sectors that declined, the worst by far were the interest-rate-sensitive real estate and utilities sectors, which have underperformed in all three quarters of 2023. Utilities have now underperformed the S&P 500 by a whopping 28 percentage points in 2023. Real estate is a debt-laden sector facing a dramatically higher cost of capital. New to the underperform list were information technology (IT) shares, which gave back a little relative to the market in the quarter but still reign supreme on almost any longer-dated time horizon. The more defensive technology stocks, Apple (AAPL) and Microsoft, underperformed, while AI plays held up better.
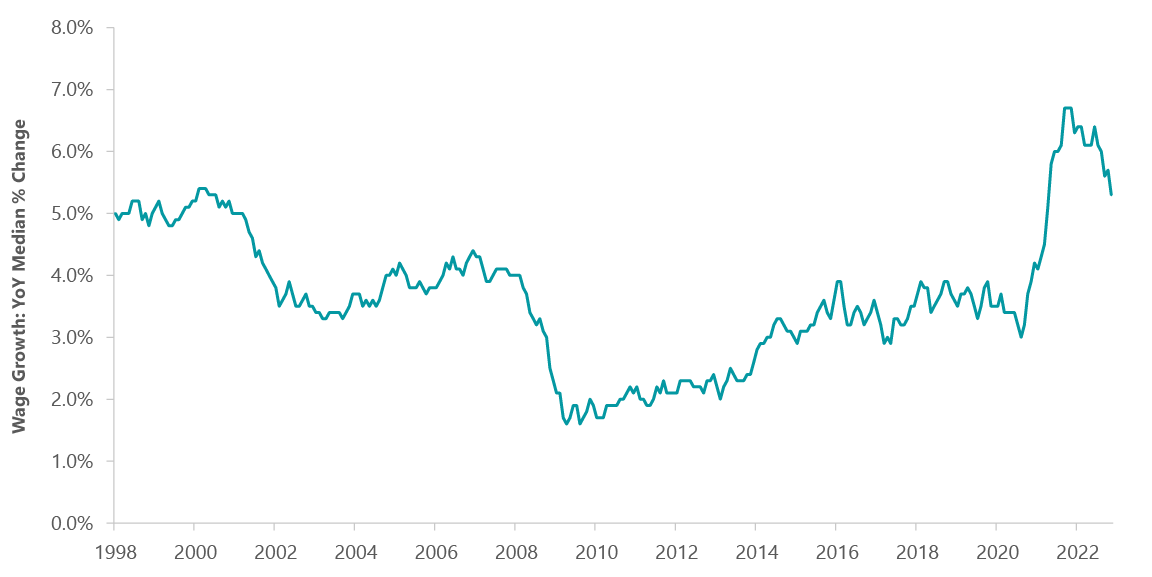
Why did the 10-year Treasury yield rise so sharply? While many measures of inflation moderated, especially the key Personal Consumption Expenditures Price Index (PCE), the Federal Reserve and the bond market may be looking for an acceleration in wage increases (Exhibit 1). The unemployment rate is low at 3.8% and the surge in union activity — the Air Line Pilots Association and Teamsters settlements, the United Auto Workers and Kaiser Permanente strikes — suggests the job market is tight. Major retailers including Walmart, Target and TJX cautioned that higher wages will pressure SG&A. In a soft landing scenario unemployment will fall and keep upward pressure on wages.
Exhibit 1: Wage Growth Remains on Accelerate
| As of Aug. 31, 2023. Source: ClearBridge Investments, Atlanta Fed, Bloomberg Finance. |
U.S. government debt passed a dangerous line in July and Treasurys are no longer looking like a riskless asset. Growth in interest expense on U.S. debt in dollars now exceeds dollar GDP growth, threatening a debt spiral. The budget deficit is running 7% despite full employment and will be far higher in a recession. To manage the deficit, the government faces stark choices the next few years, specifically higher taxes and lower spending. The term premium on bonds has risen from the -1% to -2% range of the last decade to about 0%, and it could potentially rise to the 2% area that was normal in the 1990s and 2000s.
International markets also contributed to the rate increase. Chinese economic malaise forced China’s central bank to sell Treasurys to support the yuan. Meanwhile, the Bank of Japan was forced to loosen yield curve controls, causing upward pressure on U.S. rates as traders unwound a carry trade.
“We take Fed Chair Powell at his word that policy will remain restrictive until inflation is quelled.”
A key for the market going forward is whether higher rates will turn the soft landing into a recession. Although the economy’s resilience to this point has caught us by surprise, we see signs today that the probability of a recession remains high. The yield curve has been inverted for 15 months and the Fed’s balance sheet has shrunk 10% from its peak. The flipping of the yield curve from inversion to its normal upward slope has historically been one of the best indicators of an incipient recession.
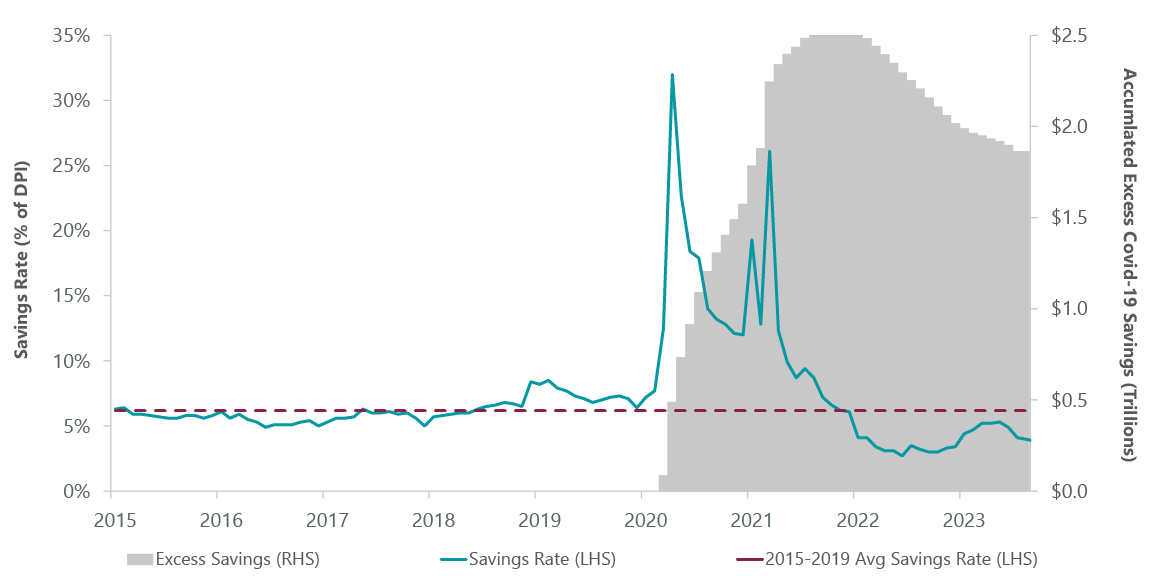
Consumer spending generates two-thirds of GDP and has been a stalwart supporting economic growth this cycle. However, the personal savings rate has been below the 2016–19 level for the past year, meaning consumers are spending beyond their means and eating into the savings glut from COVID stimulus. We estimate the excess savings will be fully spent around calendar year-end (Exhibit 2). The student loan payment moratorium has ended. Mortgage and car loan rates are the highest in 16 years. As such, we see a spending slowdown and credit normalization occurring in 2024. We believe slowing consumer spending will be evident after the holiday shopping season as bills come due, manifesting itself in lower 2024 spend and normalization in consumer loan (credit card) delinquencies.
Exhibit 2: Declining Consumer Savings Could Hurt Spending
| As of Aug. 31, 2023. Source: ClearBridge Investments, Bureau of Economic Analysis, Bloomberg Finance. |
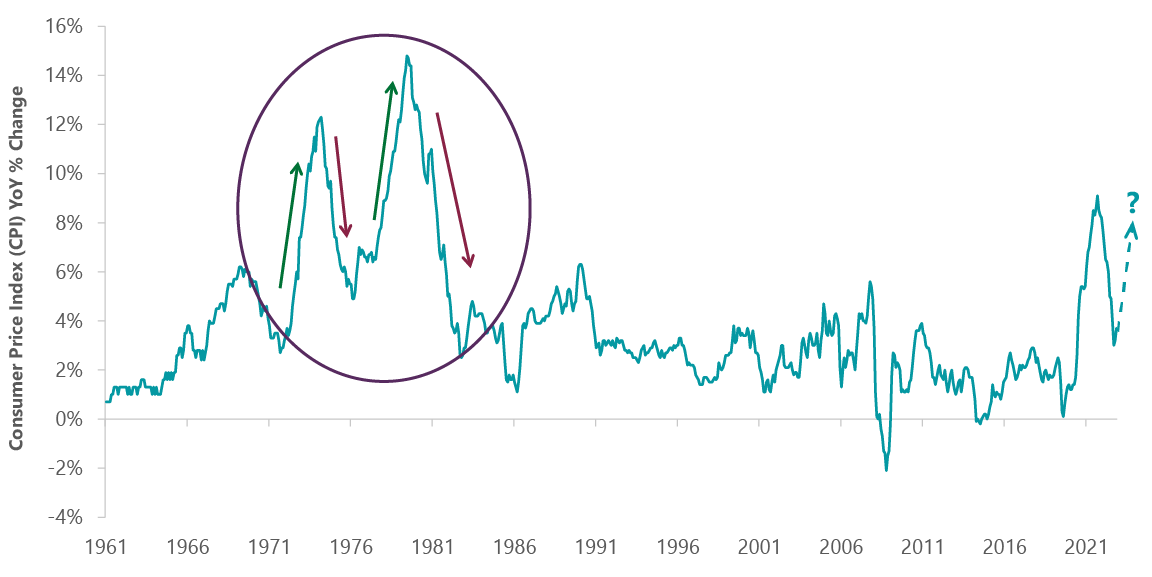
Finally, we take Fed Chair Powell at his word that policy will remain restrictive until inflation is quelled. To quote Powell from September 20, “You know sufficiently restrictive policy only when you see it. It’s not something you can arrive at with confidence in a model or various estimates.” Moreover, Powell is all too aware of the inflation double-dip that occurred during the Burns/Volcker chairmanships of the 1970s and 1980s (Exhibit 3). We believe Chairman Powell understands that getting inflation down is not the same as keeping inflation down. We expect restrictive monetary policy until the data confirms success. Our fear is that once data confirms success in battling inflation, it will be too late for a soft landing as data lags economic realities.
Exhibit 3: Inflation Has Quickly Rebounded in the Past
| As of Aug. 31, 2023. Source: ClearBridge Investments, Bureau of Labor Statistics, Bloomberg Finance. |
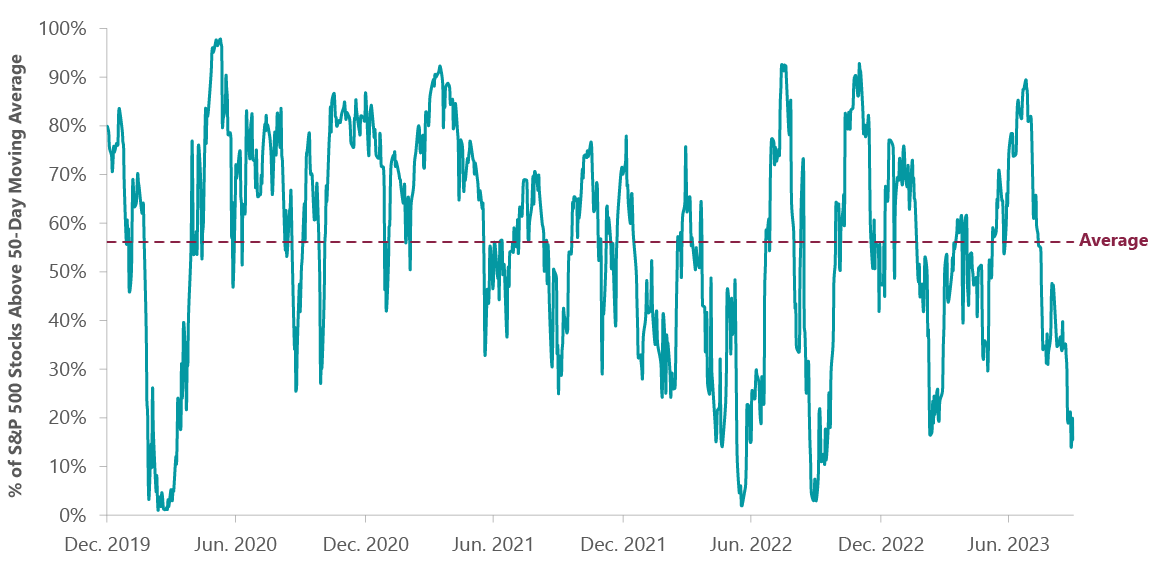
Although a 3% third-quarter decline within the context of a S&P 500 up 13% year to date may seem like healthy consolidation within the construct of a longer-term bull market, we are concerned that the average stock is mired in a downtrend. For example, only 15% of S&P 500 stocks are above their 50-day moving average versus a long-term average of 55% (Exhibit 4). Small cap stocks show similarly weak breadth and are up only 2.5% year to date, having given up the majority of gains accrued post-COVID stimulus. Finally, despite IT underperforming the S&P 500, the concentration of S&P 500 returns got worse in the third quarter. At quarter end, the “Magnificent Seven” (Alphabet, Amazon.com, Apple, Microsoft, Nvidia, Meta Platforms and Tesla) accounted for 11 percentage points of the 13% year-to-date advance, an 84% contribution to return despite being only 25% of the index’s weight. This same measure stood at 82% and 73% contribution for the first quarter and first half of the year, respectively. In sum, the S&P 500’s performance remains propped up by a cohort of mega cap growth stocks, while the average security is trending down. In our experience a narrow market with weakening fundamentals is a signal to be cautious.
Exhibit 4: Most Stocks Are Well Below 50-Day Moving Average
| As of Sept. 30, 2023. Source: ClearBridge Investments, Bloomberg Finance. |
Outlook
We believe that this year’s market increase is a rally in a multiyear bear market and that we need to retain a conservative tilt to our portfolio. We take Powell at his word that the Fed will keep financial conditions tight until it achieves its 2% inflation mandate. We are skeptical that wage inflation expectations can fall enough to meet that mandate without a material increase in the unemployment rate and the recession that would entail.
Today’s market shows many signs of danger. Stock market valuations are in the 90th percentile on almost all measures, leaving little room for error. As shown by the record spread between the National Income and Product Accounts (NIPA) earnings and reported earnings, earnings quality is poor. The federal government has a 7% budget deficit and faces a debt spiral, limiting its options should we face a recession. The average stock is in decline.
While we are optimistic about the long-term benefits generative AI will have on workplace productivity, aggressive assumptions need to be made to justify current valuations. We are positive on much of the health care sector as market expectations for medical device and life science/tool companies have come in markedly. We find the non-cyclical nature and modest valuation of pharmaceutical companies appealing. We are positive on property and casualty insurers due to their broad-based pricing power. Select industrials will see outsize growth from the energy transition. We also like materials companies such as coatings that benefit from moderation in raw material costs.
We believe investor total return expectations should be muted for the near term. But we are long-term investors. Rather than trying to project near-term earnings trends, we believe it is better to look out two to three years and make investment decisions based upon our assessment of a company’s longer-term, sustainable growth rate relative to what’s implied in today’s share price. As out-year expectations moderate for growth stocks we would be more comfortable adding risk to the portfolio. In the meantime, we are building lists of stocks to own for the long term and stand ready to take advantage of price dislocations if they occur.
Portfolio Highlights
The ClearBridge Appreciation ESG Strategy outperformed its benchmark in the third quarter, driven by positive stock selection. On an absolute basis, the Strategy had positive contributions from three of 11 sectors. The communication services, energy and consumer discretionary sectors were the positive contributors to performance, while the information technology (IT), materials and industrials sectors were the main detractors.
In relative terms, stock selection in the consumer staples, consumer discretionary and industrials sectors contributed to relative returns. Conversely, stock selection in the IT and materials sectors and an underweight to the energy sector detracted.
On an individual stock basis, the biggest contributors to absolute performance during the quarter were Alphabet, Costco (CSCO), Eli Lilly (LLY), Automatic Data Processing (ADP) and Pioneer Natural Resources (PXD). The biggest detractors were Apple, Microsoft, Merck (MRK), Honeywell (HON) and ASML.
During the quarter, we exited a position in Verizon in the communication services sector.
ESG Highlights
The Company’s Role as Steward of Biodiversity
The push to halt biodiversity loss is increasingly demanding attention alongside climate change as a major environmental concern for investors. As we explore elsewhere in a recent ClearBridge introduction and discussion of the topic, the term biodiversity, meaning the variety of life on the planet or in a given ecosystem, is emerging as an umbrella concept for several related environmental concerns. These include issues tied to changes in land usage (such as deforestation), natural resource overexploitation, pollution and the effects of climate change.
On the international stage, in an agreement recalling the 2015 Paris Agreement, attendees of the 2022 United Nations Biodiversity Conference adopted the Kunming-Montreal Global Biodiversity Framework (GBF), a plan for member countries to take urgent action to halt and reverse biodiversity loss and to conserve and sustainably use biodiversity.
As a result, regulation is stepping up. In May, an EU regulation on deforestation-free supply chains, for example, began requiring companies to confirm imported products have not been produced on land subject to deforestation or forest degradation, with fines of at least 4% of the company’s annual income in the EU at stake.
“Improving biodiversity is already an economic concern for many companies.”
In September, the Taskforce on Nature-Related Financial Disclosures (TNFD), which was launched in 2021, published recommendations on the types of biodiversity disclosures companies can and should be making. These generally involve companies disclosing how their businesses both impact and depend on nature, what related material risks and opportunities they are assessing, and what metrics and targets they are using to measure and improve. As the TNFD points out, “Present and future cash flows depend on the flow of nature’s inputs to business and accelerating nature loss poses a growing risk to businesses and capital providers.”
The materiality of biodiversity issues for public equities helps explain why ClearBridge has, over 35+ years of our ESG integration approach, assessed evolving nature-related dependencies, impacts, risks and opportunities with holdings across sectors. To support our fundamental research and steer capital in a nature-positive way, ClearBridge encourages, among other things, assessment and disclosure of nature-related impacts and dependencies within the value chain, development of biodiversity and deforestation policies, responsible waste and water management, transparency into lending practices, and consideration of local affected communities.
Nature-positive revenue opportunities tend to be tied to companies with products that either substitute for a high-impact product (ClearBridge holding Ball’s aluminum containers reduce the need for mining ore and extracting oil and are a substitute for single-use plastic, a major polluter) or reduce impact (ClearBridge holding Deere’s precision agriculture technologies limit pollution in the form of chemical pesticides and herbicides). Both types are found across ClearBridge portfolios, as well as companies providing key financing for nature-positive solutions.
Reducing Impact: Untroubling Waters
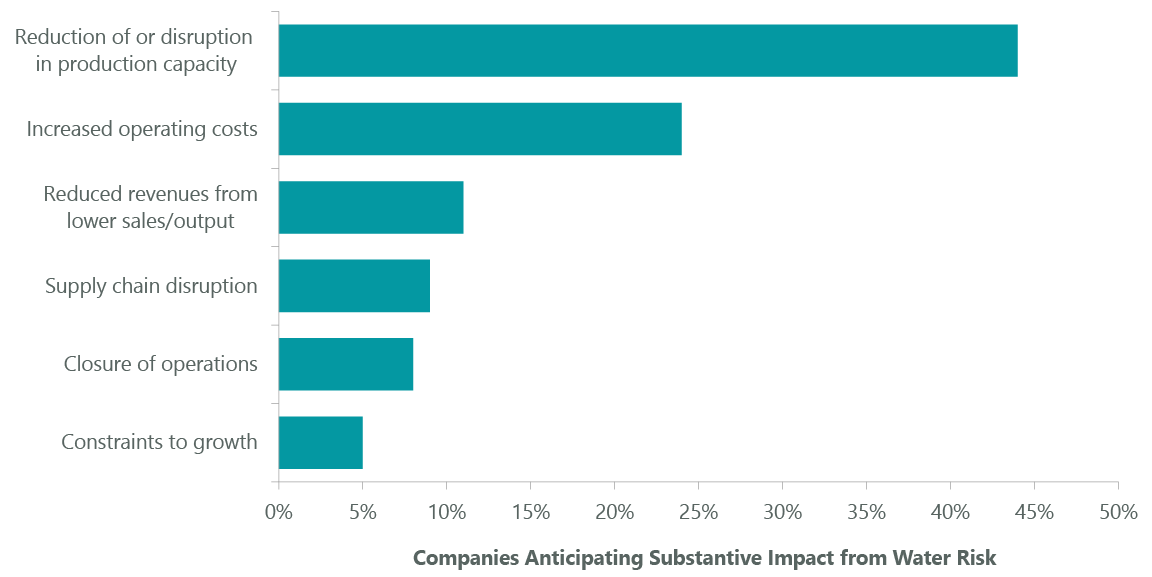
Water looms large as a high-impact natural resource, both in its use in business and its importance to virtually every ecosystem. Of companies disclosing on water via CDP, formerly the Carbon Disclosure Project, that are exposed to substantive impacts on their business from water, most anticipate that water issues could limit the growth of their business through reducing/disrupting production capacity, closure of operations or constraints to growth (Exhibit 5).
Exhibit 5: Potential Impacts of Water Risk in Direct Operations and Supply Chain
| Source: High and Dry: How Water Issues Are Stranding Assets, A report commissioned by the Swiss Federal Office for the Environment (FOEN). May 2022. |
Long-time ClearBridge holding Ecolab (ECL) stands out as a responsible steward of water resources and a company able to reduce impact from use of water across the economy. Ecolab offers water-saving solutions for laundries used by health care, hospitality and food and beverage industries. Products and services include industrial water pre-treatment systems, industrial water reuse, water-efficient conveyor lubrication systems and wastewater treatment. For a major hotel chain, Ecolab’s chemical product delivery service replaces single-use drums of cleaning chemical, reducing waste and improving work safety, while its warewashing and housekeeping solutions reduce wash time, water usage and water temperature for food prep wares as well as plastic packaging used in housekeeping services. Ecolab estimates 57 million gallons of water savings as well as 1,400 metric tons of GHG emissions annually for the hotel chain as a result.
Ecolab has committed to helping its customers conserve 300 billion gallons of water a year, equivalent to the annual drinking water needs of 1 billion people by 2030, through reducing water withdrawal needs in customers’ operations. Separately, Ecolab also has a target to restore >50% of its absolute water withdrawal at high-risk sites through collaboration with NGOs and local communities. Ecolab is also a co-founder of the Water Resilience Coalition, a CEO-led movement and part of the United Nations Global Compact aiming to preserve the world’s freshwater resources through action in water-stressed basins.
Reducing Impact: Sustainable Forestry
There are also benefits for companies that recognize and mitigate deforestation risks (Exhibit 6). Broadly, these may include, increased brand value, demand for certified or deforestation-free materials, availability of products with reduced environmental impact, supply chain transparency and resilience.1
Exhibit 6: Potential Financial Impact of Reported Forest-Related Opportunities (Billions)
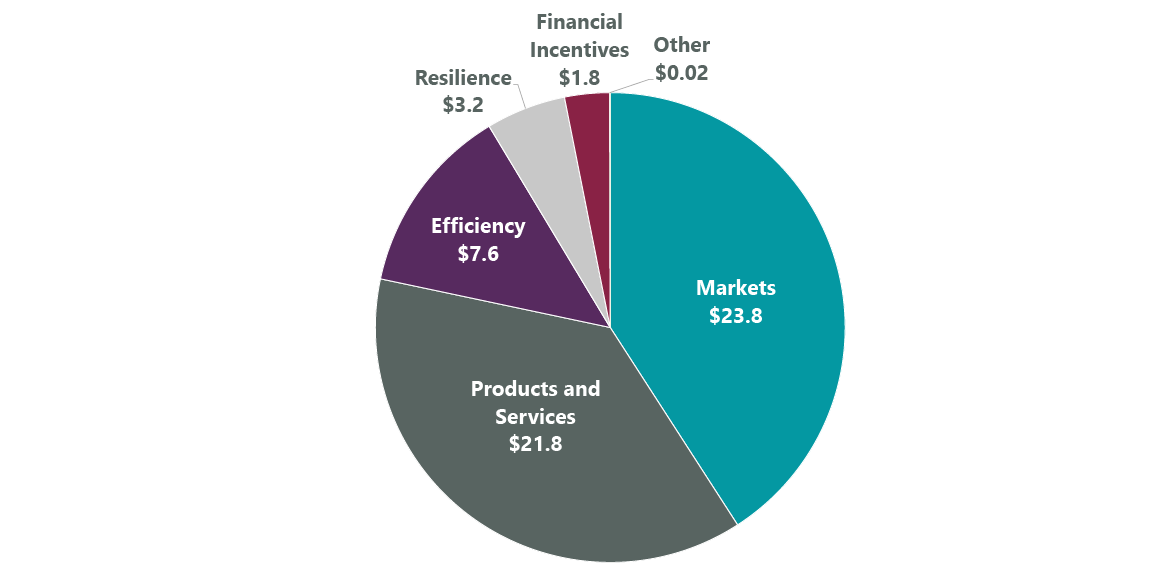
| Source: “The Forest Transition: From Risk to Resilience,” Global Forests Report 2023, CDP. July 2023. Shows forest-related opportunities identified by 231 companies reporting. Markets include increased demand for certified materials or products with reduced environmental impact; resilience includes greater supply chain resilience and climate change adaptation; products and services includes increased brand value and R&D and innovation opportunities; efficiency includes increased efficiency of manufacturing and distribution processes and cost savings; financial incentives include issuing green bonds and earning a price premium for deforestation-free materials. |
Home Depot (HD) has long been a leader in advancing sustainable forestry, and its wood products can have a significant impact, as timber rates at the top of high-risk commodities responsible for most agriculture-related deforestation (Exhibit 7). The home improvement retailer adopted its first wood purchasing policy in 1999, pledging to give preference to sustainably sourced wood and to eliminate wood purchases from endangered regions around the world.
Biodiversity-boosting efforts at Home Depot have included tracing the origin of all the wood products it sells. This forms part of the process of verifying sustainable production, which it does using the certification standards of the Forest Stewardship Council (FSC). Since 2000 Home Depot has developed programs to purchase FSC wood products, such as doors, boards and patio furniture, from over 60 global suppliers. It has also moved more than 90% of its cedar purchases to second-and third-growth forests, with the rest coming from areas with local community stakeholder review.
Exhibit 7: High-Risk Commodities for Agriculture-Related Deforestation
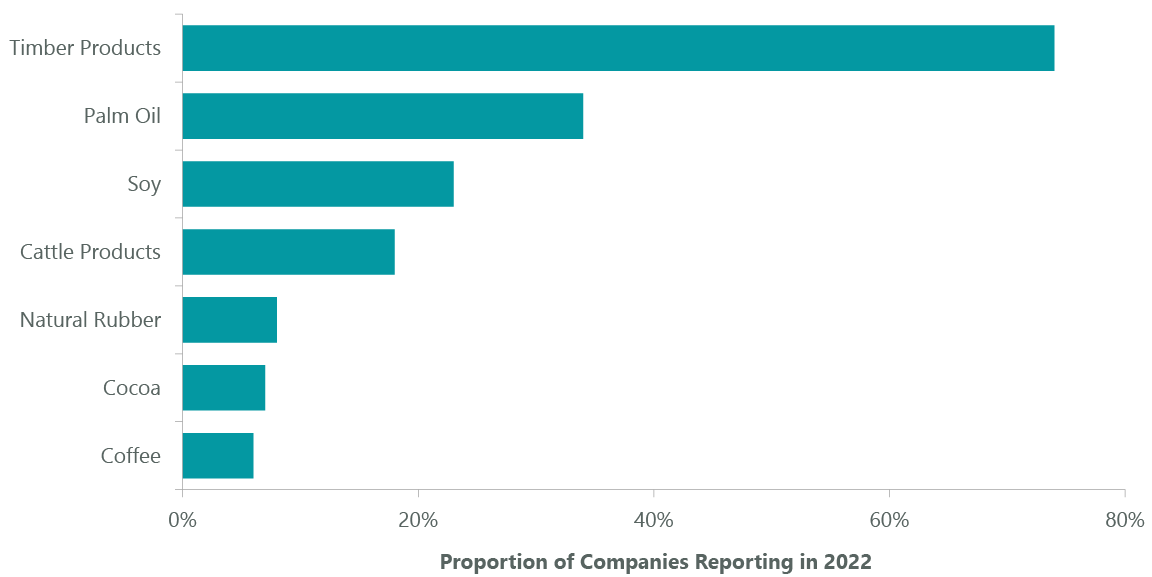
| Source: “The Forest Transition: From Risk to Resilience,” Global Forests Report 2023, CDP. July 2023. Of 810 companies disclosing on at least one of the seven high-risk commodities, equaling 1,375 commodity-level disclosures. |
Suppliers preferred by Home Depot such as Mendocino Redwood Company also help maintain sustainable forests through building forests’ wildfire resilience. For example, Mendocino practices fuel reduction by removing excess burnable materials that helps wildfires stay closer to the ground where they can be more safely controlled by firefighters before they reach the forest canopy.
Substituting Impact: Preventing Deforestation
ClearBridge holding Trex has redefined the decking industry with a business model that addresses two key drivers of biodiversity loss, deforestation and pollution, by substituting high-impact products. Instead of relying on virgin wood, Trex makes composite decking for residential and commercial customers using 95% recycled wood fibers and plastic waste. In 2022, Trex recycled 337 million pounds of waste polyethylene, a plastic commonly used for plastic bags and bottles, as it produced its high-end decking. Wood decks stopped using arsenic treatments in 2004, which has shortened their life span, dramatically increasing the number of decks that need to be replaced. Trex’s products help fill this need in a way that preserves forests, reduces a major source of pollution in oceans, and lowers customers’ total costs of ownership, since Trex’s decks have much longer lifespans relative to natural lumber decks.
Financing Biodiversity
In addition to business models that support biodiversity, it is also important to provide financing for efforts to improve biodiversity. Large financial firms such as ClearBridge holding JPMorgan Chase (JPM) have a key role here through green bond underwritings that support natural capital protection. In 2021 JPM announced a target to finance and facilitate $1 trillion toward green initiatives by 2030 as part of its broader $2.5 billion sustainable development target. The green initiatives include biodiversity-linked areas such as water management, circular economy and waste management, in addition to conservation and biodiversity, which focuses on improving terrestrial and aquatic biodiversity ecosystems or forests.
As part of this target, in 2022 JPM served as the lead underwriter for a $350 million green bond issued by The Nature Conservancy, the largest green bond issuance by a conservation nonprofit ever. The issuance is expected to help The Nature Conservancy avoid or sequester 3 billion metric tons of carbon dioxide equivalent (CO2e), and conserve 650 million hectares of healthy land, 30 million hectares of freshwater and 4 billion hectares of oceans.
Nature-Based Carbon Credits: Early Stages
JPM also highlights the value of nature-based carbon credits: these are credits a company can purchase to fund nature-based solutions to climate change to help offset its own emissions. For JPM, in addition to sourcing renewable energy to reduce its carbon footprint, it also purchases high-quality nature-based carbon credits that help restore the natural world, helping to offset the remainder of its emissions. One purchase in 2022 was from the Indus Delta Blue Carbon Project in southeastern Pakistan, one of the largest mangrove forest restoration projects in the world. Mangroves are among the world’s most diverse and vulnerable ecosystems and are effective carbon sinks; in this case they are also important habitats for endangered and threatened species and serve as a protective barrier, mitigating potential damage from hurricanes and tsunamis.
Conclusion
Improving biodiversity is already an economic concern for many companies. While developing standardized measurements of biodiversity remains an industry challenge, international agreements are spurring policy action, and the materiality of biodiversity for companies is poised to increase. As it does, ClearBridge will continue to analyze and engage companies on nature-related risks and opportunities, seeking to build more resilient businesses in a more resilient world.
Scott Glasser, Chief Investment Officer, Portfolio Manager
Michael Kagan, Managing Director, Portfolio Manager
Stephen Rigo, CFA, Director, Portfolio Manager
|
Past performance is no guarantee of future results. Copyright © 2023 ClearBridge Investments. All opinions and data included in this commentary are as of the publication date and are subject to change. The opinions and views expressed herein are of the author and may differ from other portfolio managers or the firm as a whole, and are not intended to be a forecast of future events, a guarantee of future results or investment advice. This information should not be used as the sole basis to make any investment decision. The statistics have been obtained from sources believed to be reliable, but the accuracy and completeness of this information cannot be guaranteed. Neither ClearBridge Investments, LLC nor its information providers are responsible for any damages or losses arising from any use of this information. Performance source: Internal. Benchmark source: Standard & Poor’s. 1 “The Forest Transition: From Risk to Resilience,” Global Forests Report 2023, CDP. July 2023. Page 36. |
Original Post
Editor’s Note: The summary bullets for this article were chosen by Seeking Alpha editors.
Read the full article here


Leave a Reply